
- Startseite >
- Flüsse >
- Wasserstand >
- Obere Donau >
- Roth Bleiche >
- Jahresgrafik

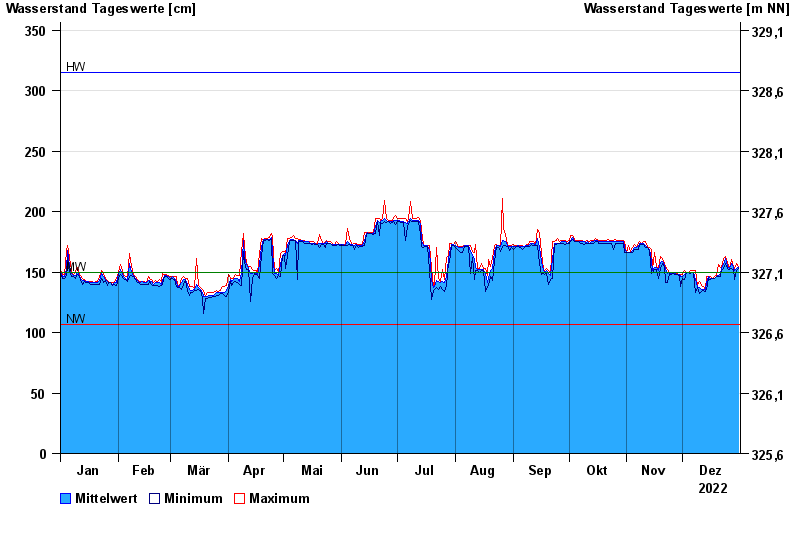
Jahresgrafik Roth Bleiche / Roth
Wasserstand vom 01.01.2022 bis zum 31.12.2022
| Datum | Mittelwert [cm] | Maximum [cm] | Minimum [cm] |
|---|---|---|---|
| 31.12.2022 | 154 | 154 | 153 |
| 30.12.2022 | 153 | 157 | 151 |
| 29.12.2022 | 151 | 153 | 144 |
| 28.12.2022 | 154 | 155 | 152 |
| 27.12.2022 | 157 | 160 | 153 |
| 26.12.2022 | 153 | 153 | 152 |
| 25.12.2022 | 155 | 158 | 153 |
© Bayerisches Landesamt für Umwelt 2025