
- Startseite >
- Flüsse >
- Wasserstand >
- Obere Donau >
- Schwandorf >
- Jahresgrafik

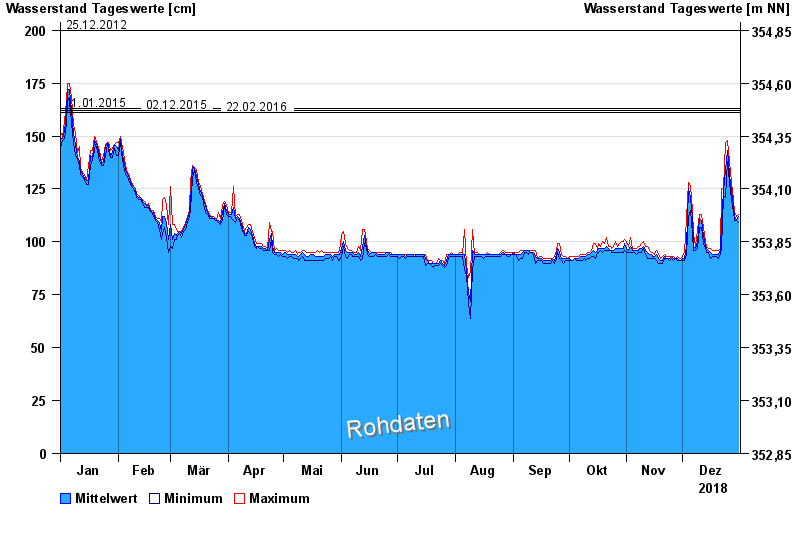
Jahresgrafik Schwandorf / Naab
Wasserstand vom 01.01.2018 bis zum 31.12.2018
Hinweis
Pegel bis auf Weiteres außer Betrieb wegen Brückenbauarbeiten.
- 04.06.2013 Wasserstand: 239 cm
- 25.12.2012 Wasserstand: 200 cm
- 11.01.2015 Wasserstand: 163 cm
- 02.12.2015 Wasserstand: 162 cm
- 22.02.2016 Wasserstand: 161 cm
| Datum | Mittelwert [cm] | Maximum [cm] | Minimum [cm] |
|---|---|---|---|
| 31.12.2018 | 112 | 113 | 109 |
| 30.12.2018 | 110 | 112 | 110 |
| 29.12.2018 | 112 | 114 | 110 |
| 28.12.2018 | 117 | 120 | 114 |
| 27.12.2018 | 124 | 128 | 120 |
| 26.12.2018 | 132 | 138 | 128 |
| 25.12.2018 | 143 | 148 | 138 |
© Bayerisches Landesamt für Umwelt 2024