
- Startseite >
- Flüsse >
- Wasserstand >
- Obere Donau >
- Treuchtlingen >
- Jahresgrafik

Jahresgrafik Treuchtlingen / Altmühl
Wasserstand vom 25.01.2021 bis zum 24.01.2022
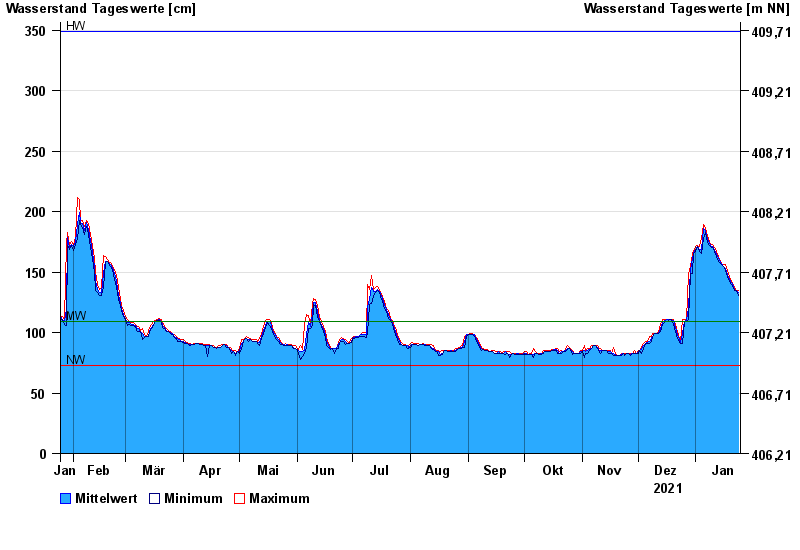
| Datum | Mittelwert [cm] | Maximum [cm] | Minimum [cm] |
|---|---|---|---|
| 24.01.2022 | 133 | 135 | 131 |
| 23.01.2022 | 135 | 135 | 135 |
| 22.01.2022 | 135 | 137 | 135 |
| 21.01.2022 | 138 | 140 | 137 |
| 20.01.2022 | 141 | 142 | 140 |
| 19.01.2022 | 144 | 146 | 142 |
| 18.01.2022 | 148 | 151 | 146 |
© Bayerisches Landesamt für Umwelt 2024