
- Startseite >
- Flüsse >
- Wasserstand >
- Obere Donau >
- Wittislingen >
- Jahresgrafik

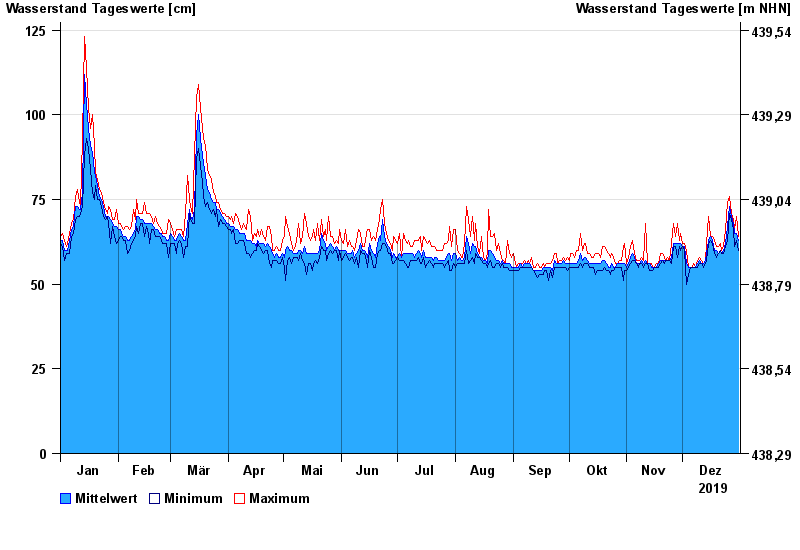
Jahresgrafik Wittislingen / Egau
Wasserstand vom 01.01.2019 bis zum 31.12.2019
- 14.04.1994 Wasserstand: 244 cm
- 15.02.1990 Wasserstand: 207 cm
- 06.01.1982 Wasserstand: 206 cm
- 14.01.2011 Wasserstand: 197 cm
- 25.03.1988 Wasserstand: 194 cm
| Datum | Mittelwert [cm] | Maximum [cm] | Minimum [cm] |
|---|---|---|---|
| 31.12.2019 | 63 | 64 | 60 |
| 30.12.2019 | 65 | 70 | 63 |
| 29.12.2019 | 65 | 66 | 61 |
| 28.12.2019 | 68 | 69 | 66 |
| 27.12.2019 | 70 | 71 | 69 |
| 26.12.2019 | 73 | 76 | 71 |
| 25.12.2019 | 67 | 74 | 63 |
© Bayerisches Landesamt für Umwelt 2025