
- Startseite >
- Flüsse >
- Wasserstand >
- Unterer Main >
- Astheim >
- Jahresgrafik

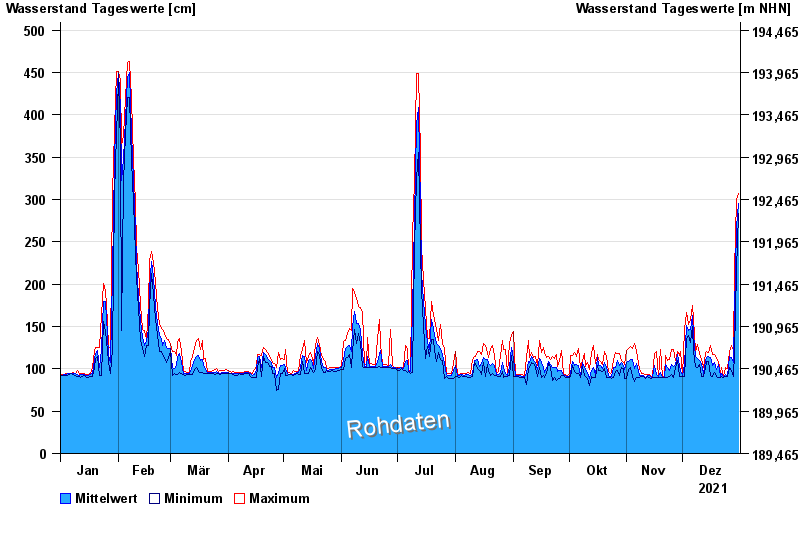
Jahresgrafik Astheim / Main
Wasserstand vom 01.01.2021 bis zum 31.12.2021
 Für diesen Pegel sind keine Hochwassermarken hinterlegt.
| Datum | Mittelwert [cm] | Maximum [cm] | Minimum [cm] |
|---|---|---|---|
| 31.12.2021 | 298 | 311 | 286 |
| 30.12.2021 | 272 | 303 | 221 |
| 29.12.2021 | 168 | 221 | 120 |
| 28.12.2021 | 108 | 121 | 90 |
| 27.12.2021 | 112 | 128 | 97 |
| 26.12.2021 | 115 | 120 | 100 |
| 25.12.2021 | 91 | 100 | 90 |
© Bayerisches Landesamt für Umwelt 2025