
- Startseite >
- Flüsse >
- Wasserstand >
- Unterer Main >
- Eschelbach >
- Jahresgrafik

Jahresgrafik Eschelbach / Inn
Wasserstand vom 01.01.2024 bis zum 31.12.2024
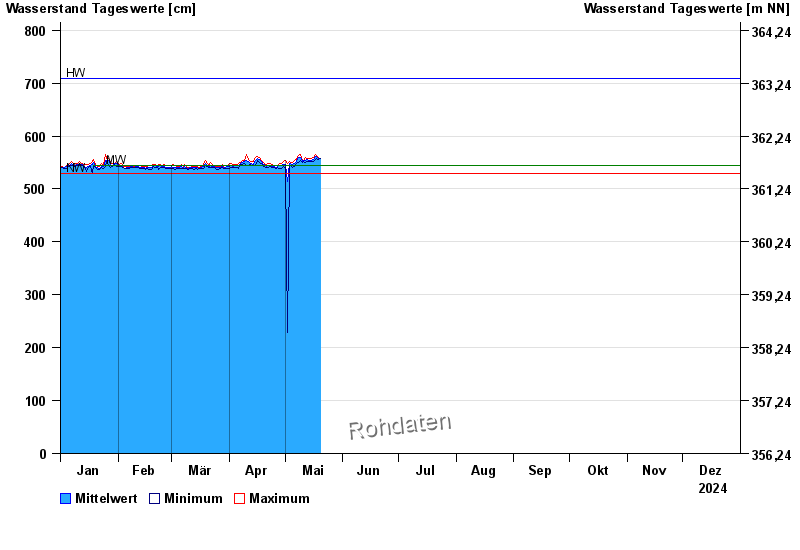
| Datum | Mittelwert [cm] | Maximum [cm] | Minimum [cm] |
|---|---|---|---|
| 12.08.2024 | 544 | 547 | 543 |
| 11.08.2024 | 547 | 553 | 541 |
| 10.08.2024 | 547 | 551 | 544 |
| 09.08.2024 | 550 | 557 | 544 |
| 08.08.2024 | 556 | 560 | 552 |
| 07.08.2024 | 551 | 554 | 549 |
| 06.08.2024 | 554 | 560 | 549 |
© Bayerisches Landesamt für Umwelt 2024