
- Startseite >
- Flüsse >
- Wasserstand >
- Unterer Main >
- Faulbach >
- Jahresgrafik

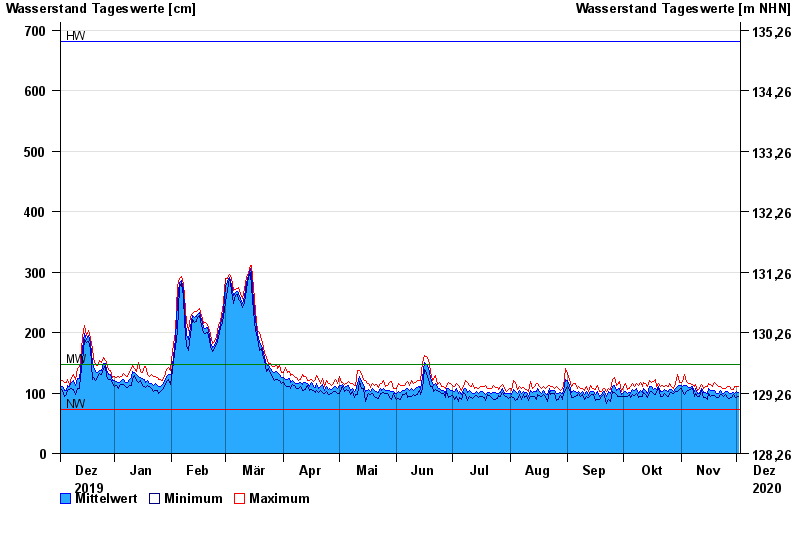
Jahresgrafik Faulbach / Main
Wasserstand vom 03.12.2019 bis zum 02.12.2020
| Datum | Mittelwert [cm] | Maximum [cm] | Minimum [cm] |
|---|---|---|---|
| 02.12.2020 | 101 | 110 | 95 |
| 01.12.2020 | 102 | 111 | 93 |
| 30.11.2020 | 100 | 111 | 95 |
| 29.11.2020 | 101 | 106 | 97 |
| 28.11.2020 | 99 | 106 | 92 |
| 27.11.2020 | 100 | 110 | 91 |
| 26.11.2020 | 103 | 110 | 93 |
© Bayerisches Landesamt für Umwelt 2024