
- Startseite >
- Flüsse >
- Wasserstand >
- Unterer Main >
- Faulbach >
- Jahresgrafik

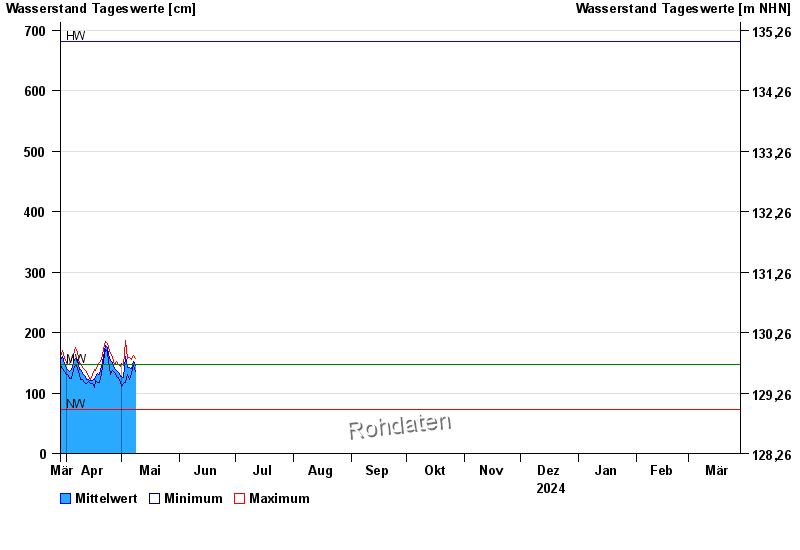
Jahresgrafik Faulbach / Main
Wasserstand vom 29.03.2024 bis zum 28.03.2025
| Datum | Mittelwert [cm] | Maximum [cm] | Minimum [cm] |
|---|---|---|---|
| 20.10.2024 | 125 | 126 | 124 |
| 19.10.2024 | 119 | 125 | 113 |
| 18.10.2024 | 128 | 143 | 117 |
| 17.10.2024 | 133 | 147 | 125 |
| 16.10.2024 | 146 | 164 | 126 |
| 15.10.2024 | 142 | 158 | 126 |
| 14.10.2024 | 136 | 147 | 126 |
© Bayerisches Landesamt für Umwelt 2024