
- Startseite >
- Flüsse >
- Wasserstand >
- Unterer Main >
- Pfarrweisach >
- Jahresgrafik

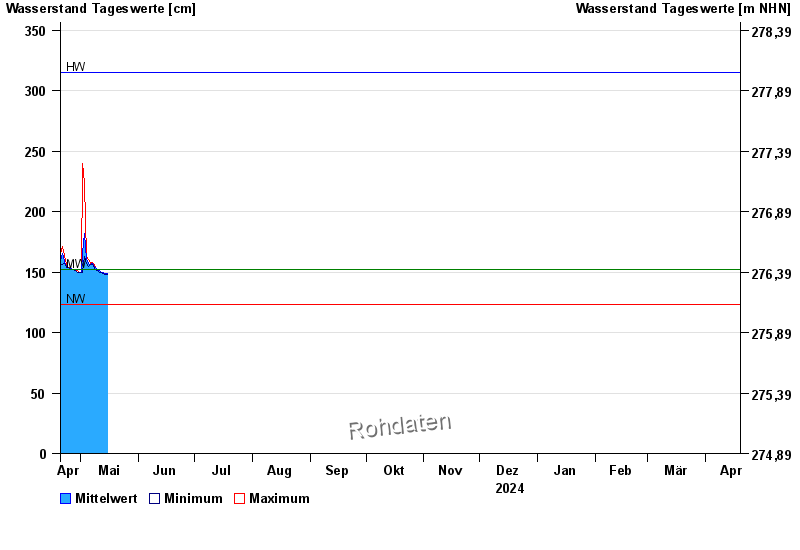
Jahresgrafik Pfarrweisach / Weisach
Wasserstand vom 20.04.2024 bis zum 19.04.2025
| Datum | Mittelwert [cm] | Maximum [cm] | Minimum [cm] |
|---|---|---|---|
| 15.10.2024 | 152 | 153 | 150 |
| 14.10.2024 | 151 | 152 | 150 |
| 13.10.2024 | 153 | 156 | 148 |
| 12.10.2024 | 151 | 153 | 148 |
| 11.10.2024 | 153 | 156 | 150 |
| 10.10.2024 | 152 | 158 | 151 |
| 09.10.2024 | 155 | 160 | 151 |
© Bayerisches Landesamt für Umwelt 2024