
- Startseite >
- Flüsse >
- Wasserstand >
- Unterer Main >
- Trunstadt >
- Jahresgrafik

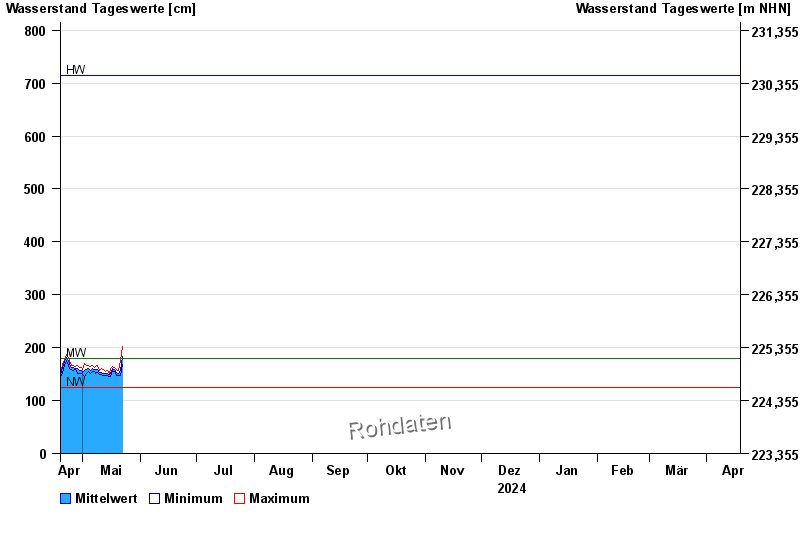
Jahresgrafik Trunstadt / Main
Wasserstand vom 19.04.2024 bis zum 18.04.2025
| Datum | Mittelwert [cm] | Maximum [cm] | Minimum [cm] |
|---|---|---|---|
| 30.06.2024 | 164 | 165 | 162 |
| 29.06.2024 | 171 | 179 | 163 |
| 28.06.2024 | 167 | 171 | 161 |
| 27.06.2024 | 161 | 164 | 155 |
| 26.06.2024 | 159 | 164 | 156 |
| 25.06.2024 | 160 | 164 | 157 |
| 24.06.2024 | 160 | 163 | 158 |
© Bayerisches Landesamt für Umwelt 2024