
- Startseite >
- Flüsse >
- Wasserstand >
- Unterer Main >
- Trunstadt >
- Jahresgrafik

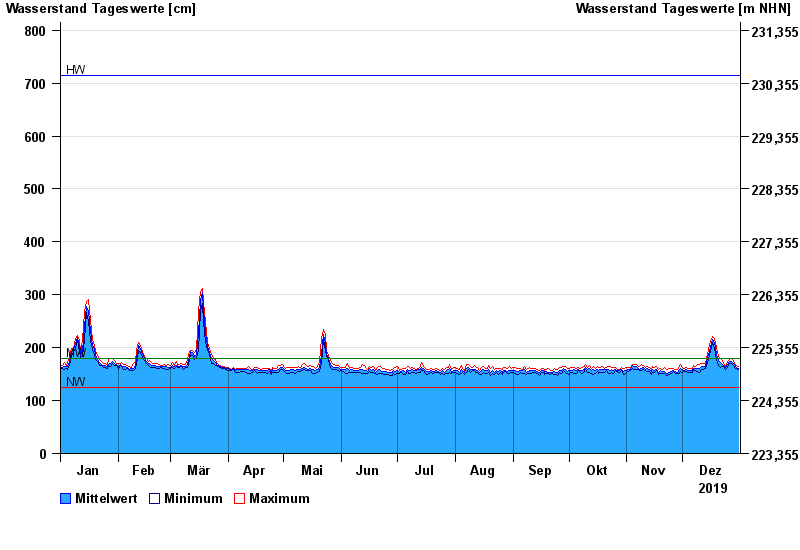
Jahresgrafik Trunstadt / Main
Wasserstand vom 01.01.2019 bis zum 31.12.2019
| Datum | Mittelwert [cm] | Maximum [cm] | Minimum [cm] |
|---|---|---|---|
| 31.12.2019 | 161 | 164 | 159 |
| 30.12.2019 | 163 | 167 | 160 |
| 29.12.2019 | 168 | 171 | 163 |
| 28.12.2019 | 170 | 175 | 166 |
| 27.12.2019 | 173 | 179 | 171 |
| 26.12.2019 | 173 | 178 | 170 |
| 25.12.2019 | 169 | 174 | 162 |
© Bayerisches Landesamt für Umwelt 2024