
- Startseite >
- Flüsse >
- Wasserstand >
- Naab - Regen >
- Erbendorf >
- Jahresgrafik

Jahresgrafik Erbendorf / Fichtelnaab
Wasserstand vom 18.04.2022 bis zum 17.04.2023
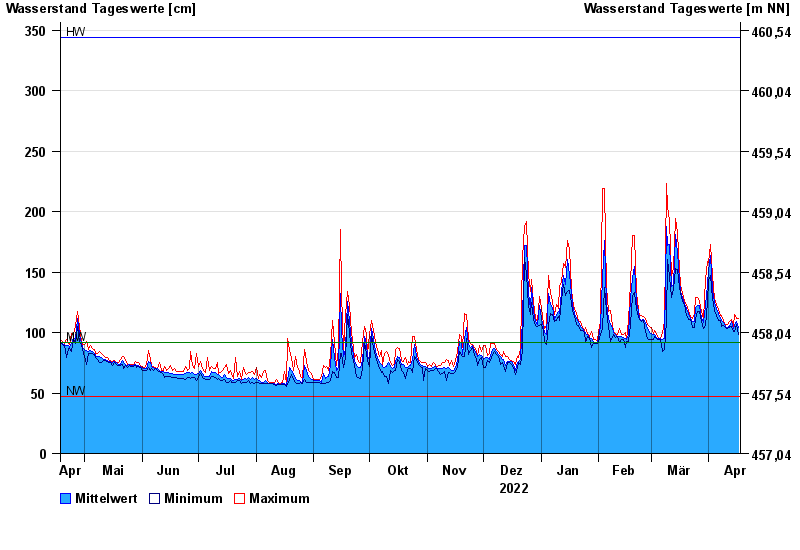
| Datum | Mittelwert [cm] | Maximum [cm] | Minimum [cm] |
|---|---|---|---|
| 17.04.2023 | 104 | 112 | 98 |
| 16.04.2023 | 109 | 112 | 107 |
| 15.04.2023 | 106 | 115 | 101 |
| 14.04.2023 | 103 | 105 | 101 |
| 13.04.2023 | 109 | 111 | 105 |
| 12.04.2023 | 105 | 109 | 104 |
| 11.04.2023 | 104 | 107 | 103 |
© Bayerisches Landesamt für Umwelt 2024