
- Startseite >
- Flüsse >
- Wasserstand >
- Naab - Regen >
- Erbendorf >
- Jahresgrafik

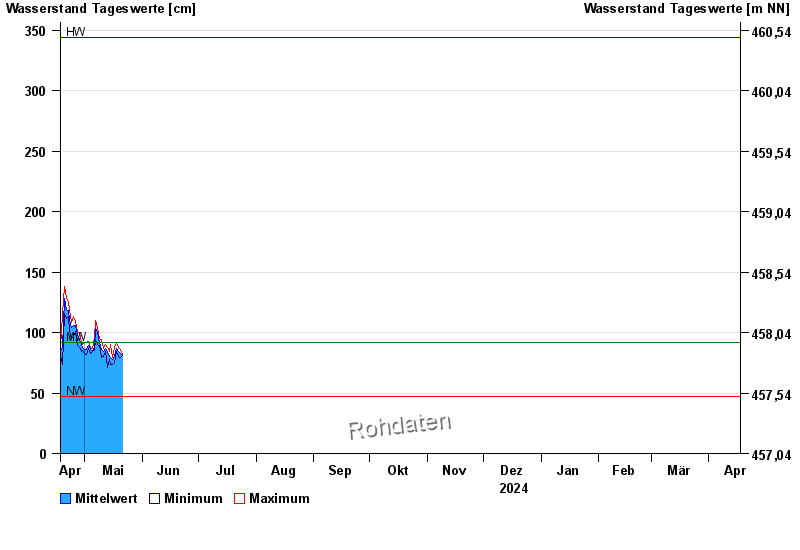
Jahresgrafik Erbendorf / Fichtelnaab
Wasserstand vom 18.04.2024 bis zum 17.04.2025
| Datum | Mittelwert [cm] | Maximum [cm] | Minimum [cm] |
|---|---|---|---|
| 14.09.2024 | 68 | 72 | 65 |
| 13.09.2024 | 71 | 76 | 61 |
| 12.09.2024 | 74 | 82 | 72 |
| 11.09.2024 | 73 | 75 | 70 |
| 10.09.2024 | 76 | 80 | 74 |
| 09.09.2024 | 79 | 95 | 65 |
| 08.09.2024 | 65 | 79 | 62 |
© Bayerisches Landesamt für Umwelt 2024