
- Startseite >
- Flüsse >
- Wasserstand >
- Naab - Regen >
- Plattling >
- Jahresgrafik

Jahresgrafik Plattling / Isar
Wasserstand vom 06.12.2019 bis zum 05.12.2020
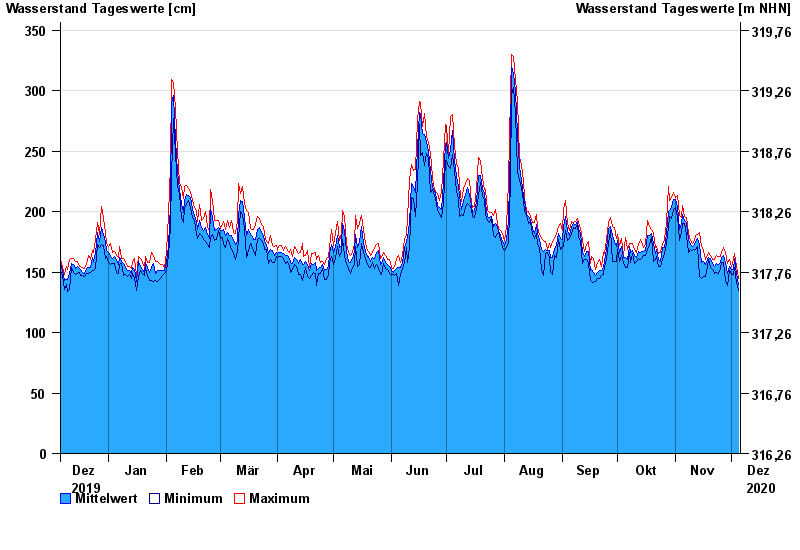
| Datum | Mittelwert [cm] | Maximum [cm] | Minimum [cm] |
|---|---|---|---|
| 05.12.2020 | 140 | 145 | 135 |
| 04.12.2020 | 149 | 155 | 141 |
| 03.12.2020 | 161 | 165 | 154 |
| 02.12.2020 | 152 | 160 | 148 |
| 01.12.2020 | 152 | 155 | 148 |
| 30.11.2020 | 155 | 160 | 151 |
| 29.11.2020 | 149 | 157 | 139 |
© Bayerisches Landesamt für Umwelt 2024