
- Startseite >
- Flüsse >
- Wasserstand >
- Naab - Regen >
- Plattling >
- Jahresgrafik

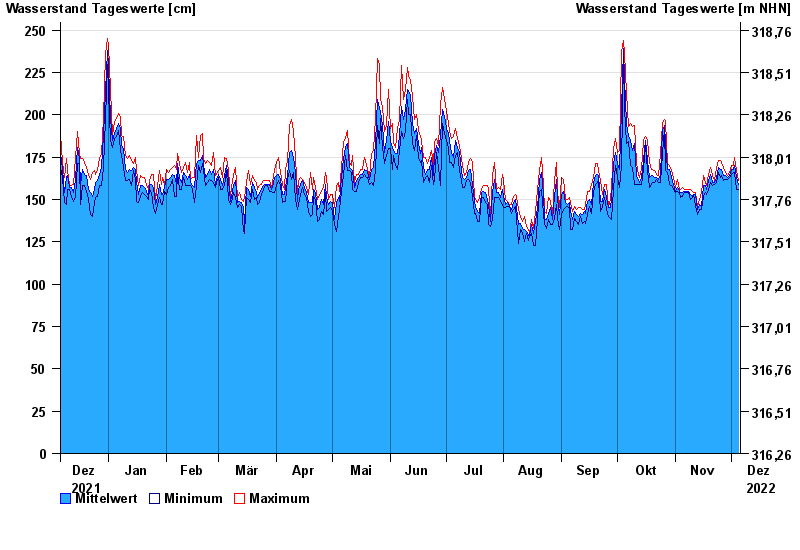
Jahresgrafik Plattling / Isar
Wasserstand vom 06.12.2021 bis zum 05.12.2022
| Datum | Mittelwert [cm] | Maximum [cm] | Minimum [cm] |
|---|---|---|---|
| 05.12.2022 | 159 | 161 | 156 |
| 04.12.2022 | 163 | 167 | 156 |
| 03.12.2022 | 170 | 175 | 166 |
| 02.12.2022 | 168 | 170 | 166 |
| 01.12.2022 | 168 | 170 | 165 |
| 30.11.2022 | 164 | 166 | 163 |
| 29.11.2022 | 163 | 164 | 162 |
© Bayerisches Landesamt für Umwelt 2024