
- Startseite >
- Flüsse >
- Wasserstand >
- Naab - Regen >
- Schlehdorf >
- Jahresgrafik

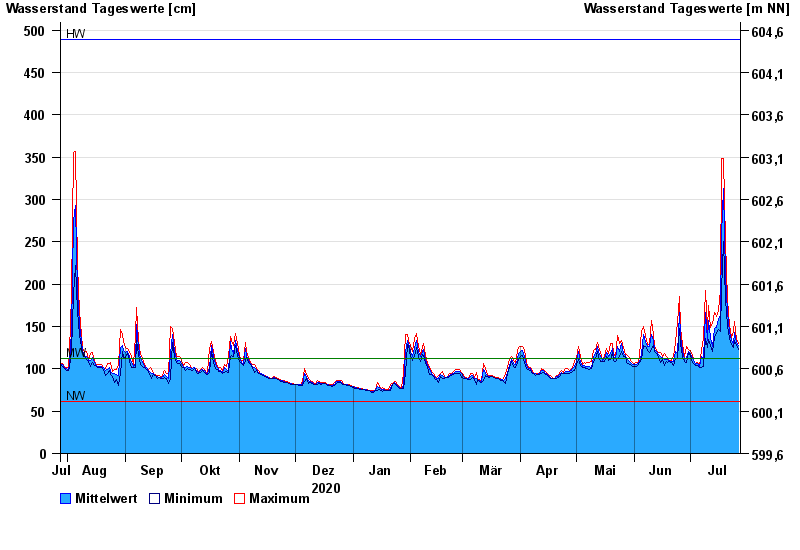
Jahresgrafik Schlehdorf / Loisach
Wasserstand vom 28.07.2020 bis zum 27.07.2021
| Datum | Mittelwert [cm] | Maximum [cm] | Minimum [cm] |
|---|---|---|---|
| 27.07.2021 | 127 | 130 | 123 |
| 26.07.2021 | 131 | 135 | 127 |
| 25.07.2021 | 143 | 156 | 134 |
| 24.07.2021 | 129 | 144 | 125 |
| 23.07.2021 | 133 | 137 | 129 |
| 22.07.2021 | 143 | 151 | 136 |
| 21.07.2021 | 166 | 182 | 151 |
© Bayerisches Landesamt für Umwelt 2024