
- Startseite >
- Flüsse >
- Wasserstand >
- Naab - Regen >
- Weiden >
- Jahresgrafik

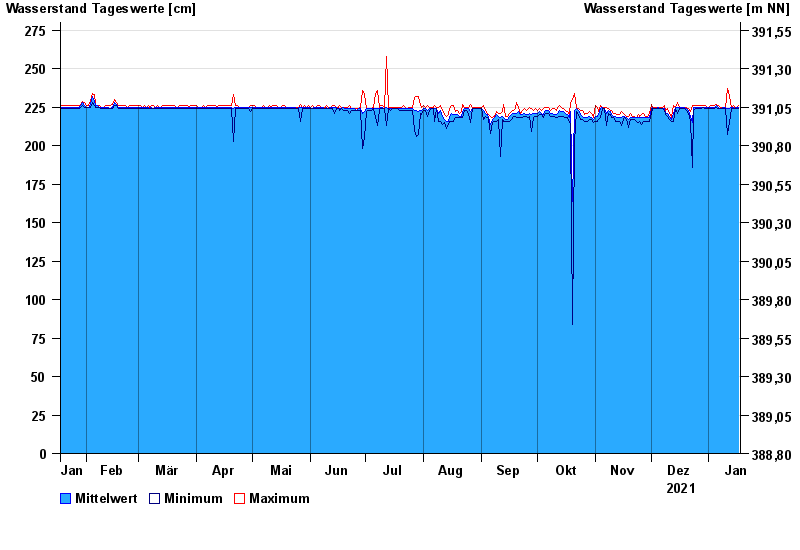
Jahresgrafik Weiden / Waldnaab
Wasserstand vom 18.01.2021 bis zum 17.01.2022
| Datum | Mittelwert [cm] | Maximum [cm] | Minimum [cm] |
|---|---|---|---|
| 17.01.2022 | 225 | 226 | 224 |
| 16.01.2022 | 225 | 225 | 224 |
| 15.01.2022 | 224 | 225 | 224 |
| 14.01.2022 | 225 | 226 | 224 |
| 13.01.2022 | 225 | 225 | 224 |
| 12.01.2022 | 224 | 232 | 215 |
| 11.01.2022 | 224 | 237 | 207 |
© Bayerisches Landesamt für Umwelt 2024