
- Startseite >
- Flüsse >
- Wasserstand >
- Untere Donau >
- Chamerau >
- Jahresgrafik

Jahresgrafik Chamerau / Regen
Wasserstand vom 10.07.2021 bis zum 09.07.2022
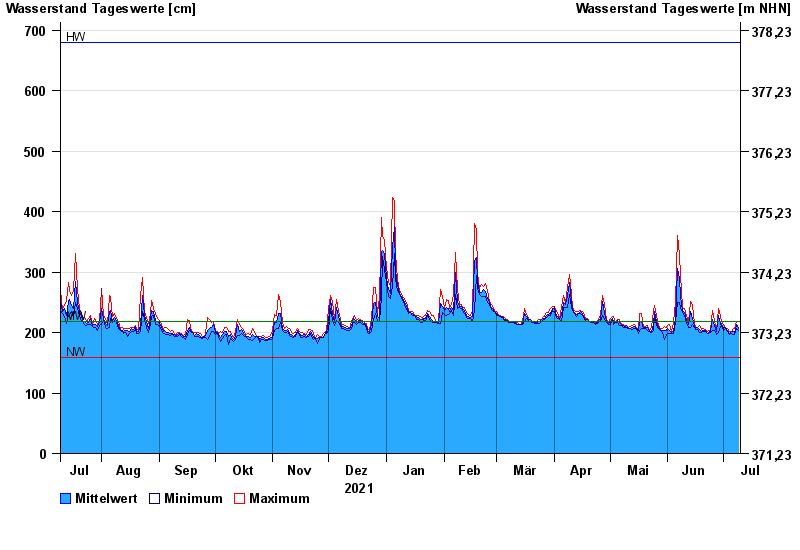
| Datum | Mittelwert [cm] | Maximum [cm] | Minimum [cm] |
|---|---|---|---|
| 09.07.2022 | 207 | 218 | 204 |
| 08.07.2022 | 214 | 218 | 206 |
| 07.07.2022 | 199 | 206 | 196 |
| 06.07.2022 | 201 | 207 | 196 |
| 05.07.2022 | 201 | 202 | 199 |
| 04.07.2022 | 198 | 201 | 196 |
| 03.07.2022 | 204 | 207 | 201 |
© Bayerisches Landesamt für Umwelt 2024