
- Startseite >
- Flüsse >
- Wasserstand >
- Untere Donau >
- Erlachleiten >
- Jahresgrafik

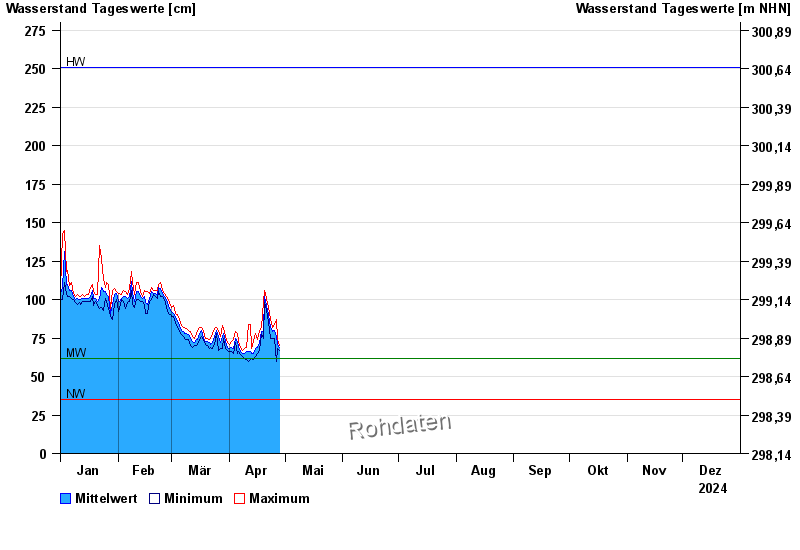
Jahresgrafik Erlachleiten / Erlau
Wasserstand vom 01.01.2024 bis zum 31.12.2024
| Datum | Mittelwert [cm] | Maximum [cm] | Minimum [cm] |
|---|---|---|---|
| 31.12.2024 | 69 | 70 | 68 |
| 30.12.2024 | 71 | 73 | 69 |
| 29.12.2024 | 73 | 74 | 72 |
| 28.12.2024 | 73 | 81 | 62 |
| 27.12.2024 | 76 | 80 | 70 |
| 26.12.2024 | 78 | 83 | 75 |
| 25.12.2024 | 81 | 86 | 78 |
© Bayerisches Landesamt für Umwelt 2025