
- Startseite >
- Flüsse >
- Wasserstand >
- Untere Donau >
- Erlachleiten >
- Jahresgrafik

Jahresgrafik Erlachleiten / Erlau
Wasserstand vom 30.05.2022 bis zum 29.05.2023
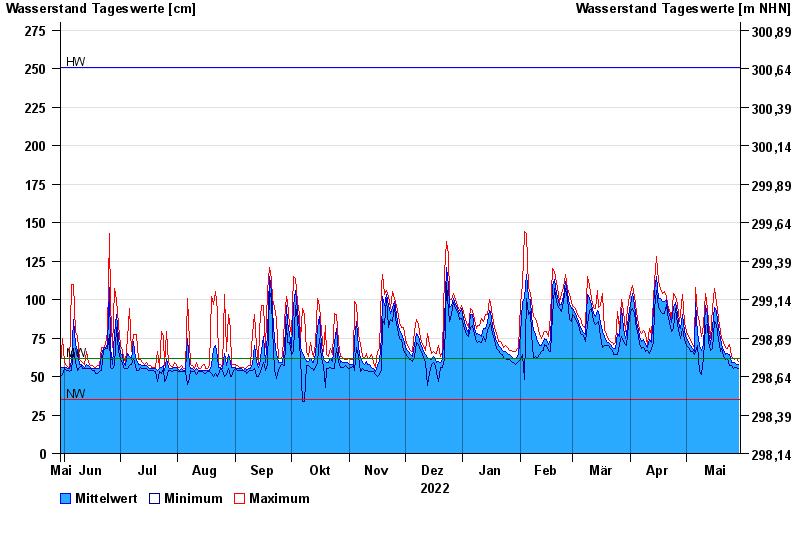
| Datum | Mittelwert [cm] | Maximum [cm] | Minimum [cm] |
|---|---|---|---|
| 29.05.2023 | 58 | 60 | 55 |
| 28.05.2023 | 58 | 62 | 56 |
| 27.05.2023 | 59 | 61 | 56 |
| 26.05.2023 | 59 | 62 | 55 |
| 25.05.2023 | 59 | 63 | 57 |
| 24.05.2023 | 64 | 71 | 57 |
| 23.05.2023 | 65 | 68 | 62 |
© Bayerisches Landesamt für Umwelt 2024