
- Startseite >
- Flüsse >
- Wasserstand >
- Untere Donau >
- Eschlkam >
- Jahresgrafik

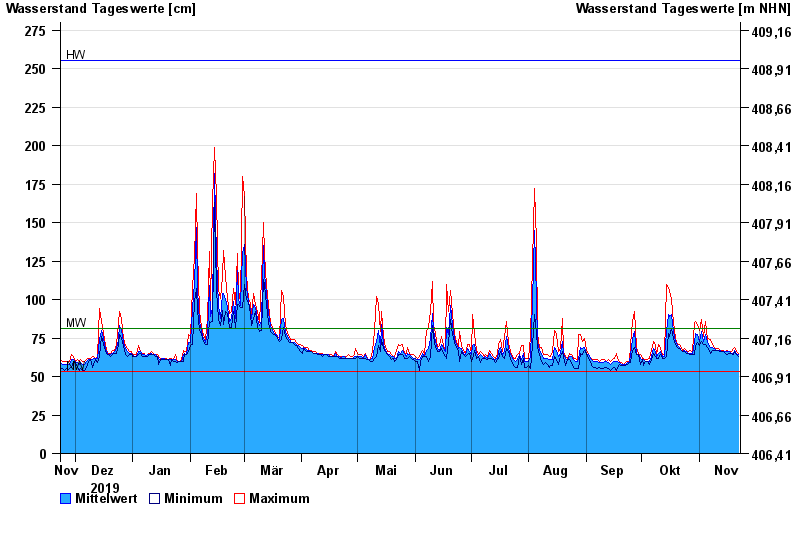
Jahresgrafik Eschlkam / Chamb
Wasserstand vom 23.11.2019 bis zum 22.11.2020
| Datum | Mittelwert [cm] | Maximum [cm] | Minimum [cm] |
|---|---|---|---|
| 22.11.2020 | 64 | 65 | 63 |
| 21.11.2020 | 65 | 66 | 64 |
| 20.11.2020 | 67 | 69 | 66 |
| 19.11.2020 | 65 | 68 | 64 |
| 18.11.2020 | 65 | 66 | 65 |
| 17.11.2020 | 66 | 66 | 65 |
| 16.11.2020 | 66 | 67 | 64 |
© Bayerisches Landesamt für Umwelt 2025