
- Startseite >
- Flüsse >
- Wasserstand >
- Untere Donau >
- Eschlkam >
- Jahresgrafik

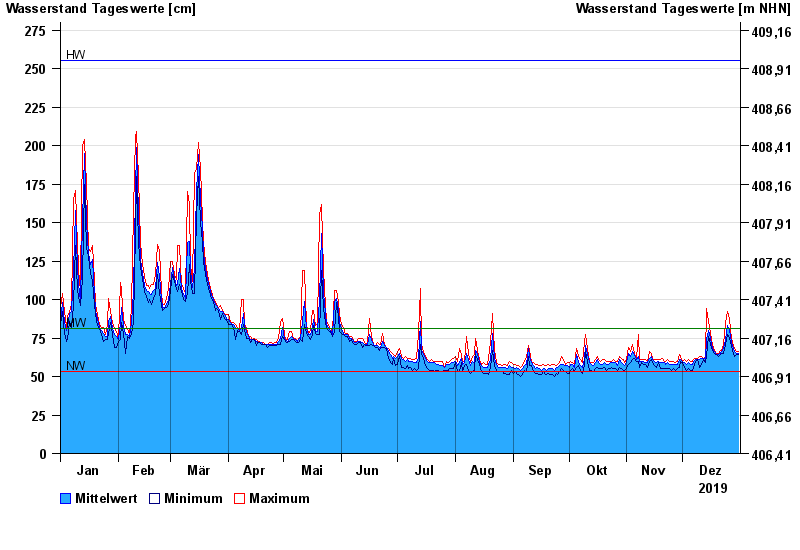
Jahresgrafik Eschlkam / Chamb
Wasserstand vom 01.01.2019 bis zum 31.12.2019
| Datum | Mittelwert [cm] | Maximum [cm] | Minimum [cm] |
|---|---|---|---|
| 31.12.2019 | 65 | 66 | 64 |
| 30.12.2019 | 65 | 66 | 64 |
| 29.12.2019 | 66 | 68 | 63 |
| 28.12.2019 | 68 | 70 | 64 |
| 27.12.2019 | 72 | 75 | 70 |
| 26.12.2019 | 80 | 87 | 75 |
| 25.12.2019 | 83 | 92 | 77 |
© Bayerisches Landesamt für Umwelt 2025