
- Startseite >
- Flüsse >
- Wasserstand >
- Untere Donau >
- Grafenau >
- Jahresgrafik

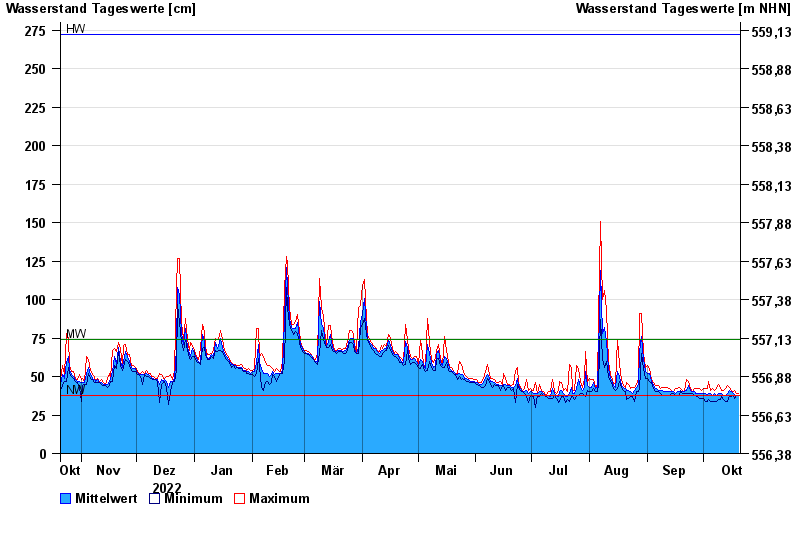
Jahresgrafik Grafenau / Kleine Ohe
Wasserstand vom 21.10.2022 bis zum 20.10.2023
| Datum | Mittelwert [cm] | Maximum [cm] | Minimum [cm] |
|---|---|---|---|
| 20.10.2023 | 38 | 39 | 38 |
| 19.10.2023 | 38 | 39 | 38 |
| 18.10.2023 | 38 | 41 | 36 |
| 17.10.2023 | 39 | 40 | 38 |
| 16.10.2023 | 40 | 41 | 37 |
| 15.10.2023 | 41 | 43 | 38 |
| 14.10.2023 | 39 | 44 | 34 |
© Bayerisches Landesamt für Umwelt 2024