
- Startseite >
- Flüsse >
- Wasserstand >
- Untere Donau >
- Pfatter >
- Jahresgrafik

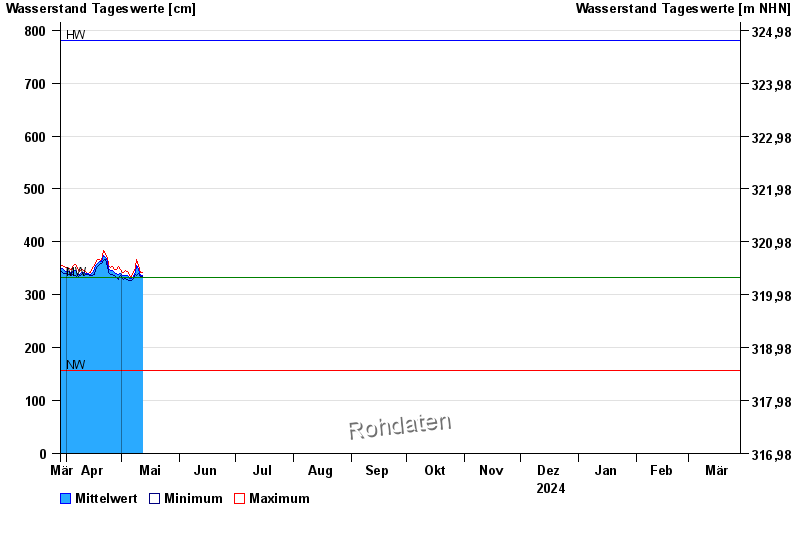
Jahresgrafik Pfatter / Donau
Wasserstand vom 29.03.2024 bis zum 28.03.2025
| Datum | Mittelwert [cm] | Maximum [cm] | Minimum [cm] |
|---|---|---|---|
| 09.08.2024 | 327 | 333 | 324 |
| 08.08.2024 | 326 | 331 | 323 |
| 07.08.2024 | 325 | 330 | 323 |
| 06.08.2024 | 334 | 340 | 328 |
| 05.08.2024 | 340 | 344 | 333 |
| 04.08.2024 | 342 | 346 | 338 |
| 03.08.2024 | 343 | 350 | 334 |
© Bayerisches Landesamt für Umwelt 2024