
- Startseite >
- Flüsse >
- Wasserstand >
- Untere Donau >
- Pfelling >
- Jahresgrafik

Jahresgrafik Pfelling / Donau
Wasserstand vom 25.09.2019 bis zum 24.09.2020
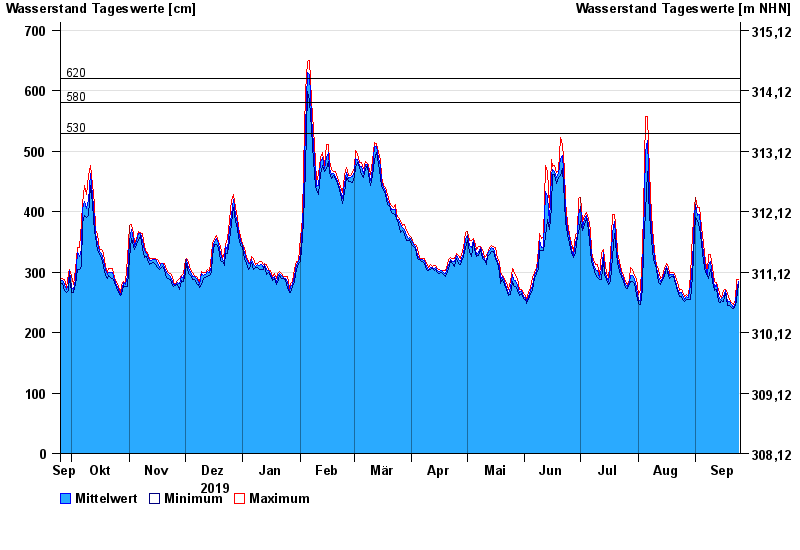
- 530 cm: Pfelling-Mariaposching: alle Schöpfwerke in Betrieb
- 580 cm: Pfelling-Mariaposching: Überflutung der Vorländer beginnt
- 620 cm: Pfelling: Höchster Schiffahrtswasserstand (HSW).
- 920 cm: Pfelling: beginnende Überströmung der Hochwasserschutzmauer
- 920 cm: Pfelling-Mariaposching: beginnende Überströmung der Hauptdeiche
| Datum | Mittelwert [cm] | Maximum [cm] | Minimum [cm] |
|---|---|---|---|
| 24.09.2020 | 284 | 287 | 279 |
| 23.09.2020 | 267 | 287 | 253 |
| 22.09.2020 | 250 | 253 | 245 |
| 21.09.2020 | 242 | 246 | 239 |
| 20.09.2020 | 246 | 250 | 241 |
| 19.09.2020 | 251 | 255 | 244 |
| 18.09.2020 | 252 | 264 | 245 |
© Bayerisches Landesamt für Umwelt 2025