
- Startseite >
- Flüsse >
- Wasserstand >
- Untere Donau >
- Plattling >
- Jahresgrafik

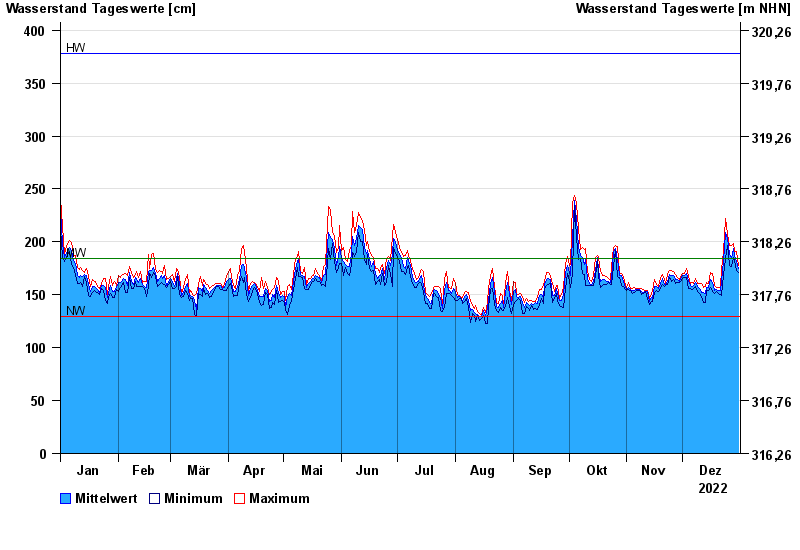
Jahresgrafik Plattling / Isar
Wasserstand vom 01.01.2022 bis zum 31.12.2022
| Datum | Mittelwert [cm] | Maximum [cm] | Minimum [cm] |
|---|---|---|---|
| 31.12.2022 | 175 | 178 | 171 |
| 30.12.2022 | 181 | 191 | 173 |
| 29.12.2022 | 187 | 191 | 182 |
| 28.12.2022 | 194 | 198 | 185 |
| 27.12.2022 | 184 | 197 | 177 |
| 26.12.2022 | 189 | 197 | 178 |
| 25.12.2022 | 203 | 207 | 197 |
© Bayerisches Landesamt für Umwelt 2025