
- Startseite >
- Flüsse >
- Wasserstand >
- Untere Donau >
- Plattling >
- Jahresgrafik

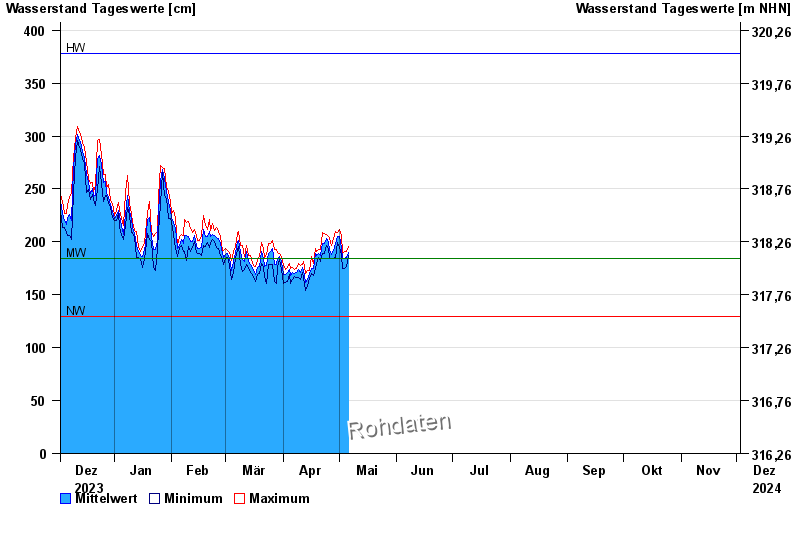
Jahresgrafik Plattling / Isar
Wasserstand vom 03.12.2023 bis zum 02.12.2024
| Datum | Mittelwert [cm] | Maximum [cm] | Minimum [cm] |
|---|---|---|---|
| 17.10.2024 | 219 | 221 | 218 |
| 16.10.2024 | 224 | 229 | 219 |
| 15.10.2024 | 222 | 232 | 211 |
| 14.10.2024 | 223 | 227 | 218 |
| 13.10.2024 | 233 | 243 | 218 |
| 12.10.2024 | 239 | 243 | 232 |
| 11.10.2024 | 237 | 246 | 225 |
© Bayerisches Landesamt für Umwelt 2024