
- Startseite >
- Flüsse >
- Wasserstand >
- Untere Donau >
- Seebruck >
- Jahresgrafik

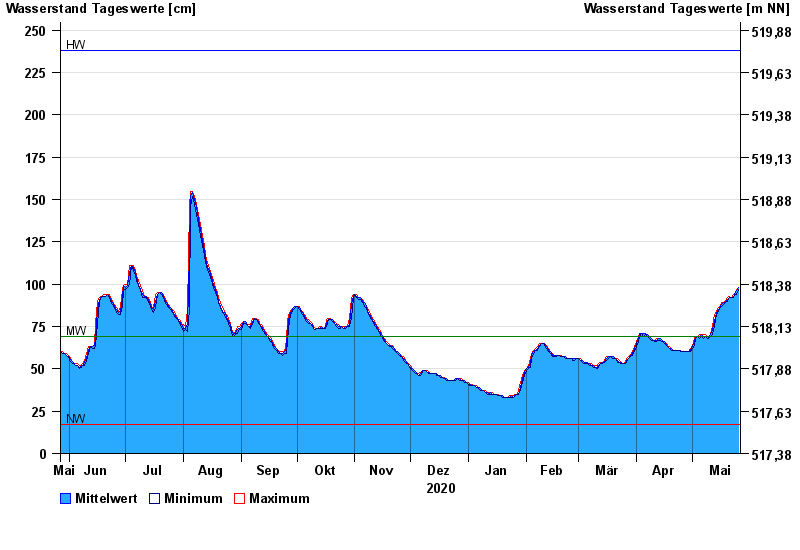
Jahresgrafik Seebruck / Alz
Wasserstand vom 27.05.2020 bis zum 26.05.2021
| Datum | Mittelwert [cm] | Maximum [cm] | Minimum [cm] |
|---|---|---|---|
| 26.05.2021 | 98 | 98 | 97 |
| 25.05.2021 | 96 | 97 | 94 |
| 24.05.2021 | 94 | 94 | 94 |
| 23.05.2021 | 92 | 94 | 92 |
| 22.05.2021 | 92 | 92 | 92 |
| 21.05.2021 | 92 | 93 | 92 |
| 20.05.2021 | 91 | 92 | 90 |
© Bayerisches Landesamt für Umwelt 2025