
- Startseite >
- Flüsse >
- Wasserstand >
- Untere Donau >
- Staudach >
- Jahresgrafik

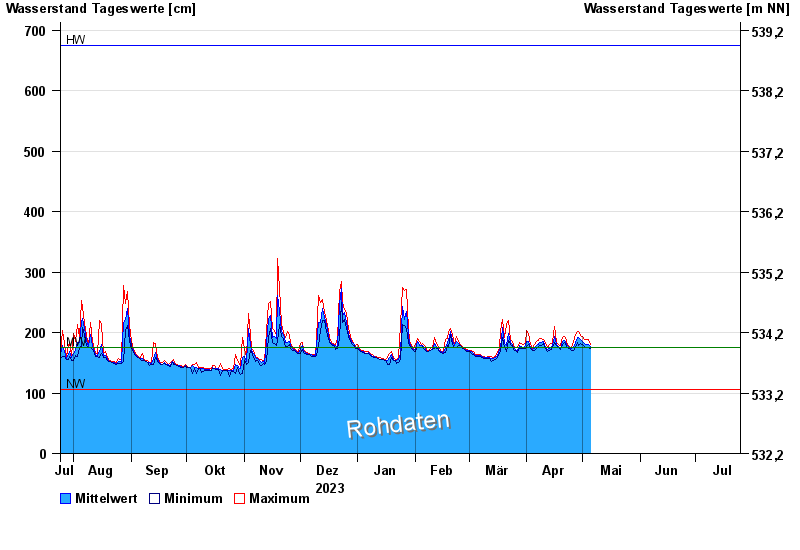
Jahresgrafik Staudach / Tiroler Achen
Wasserstand vom 25.07.2023 bis zum 24.07.2024
| Datum | Mittelwert [cm] | Maximum [cm] | Minimum [cm] |
|---|---|---|---|
| 24.07.2024 | 187 | 206 | 171 |
| 23.07.2024 | 181 | 192 | 173 |
| 22.07.2024 | 173 | 190 | 164 |
| 21.07.2024 | 160 | 164 | 158 |
| 20.07.2024 | 166 | 176 | 161 |
| 19.07.2024 | 163 | 170 | 161 |
| 18.07.2024 | 168 | 170 | 164 |
© Bayerisches Landesamt für Umwelt 2024