
- Startseite >
- Flüsse >
- Wasserstand >
- Untere Donau >
- Teisnach >
- Jahresgrafik

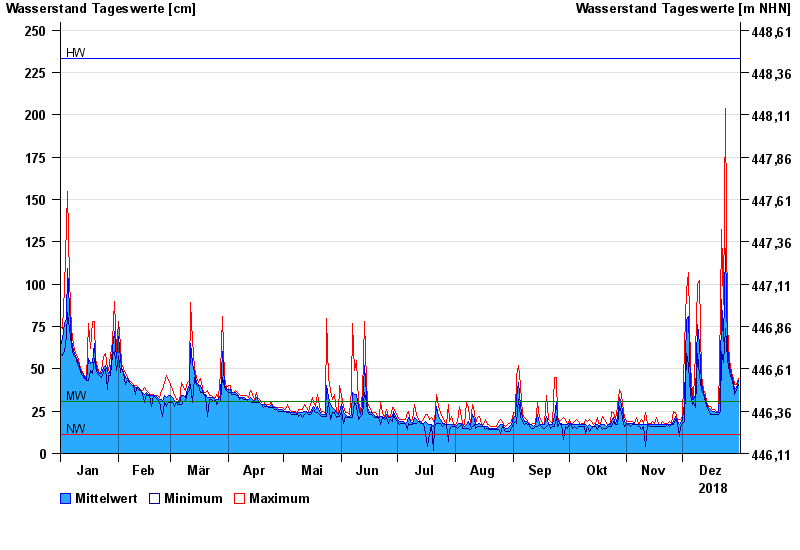
Jahresgrafik Teisnach / Teisnach
Wasserstand vom 01.01.2018 bis zum 31.12.2018
| Datum | Mittelwert [cm] | Maximum [cm] | Minimum [cm] |
|---|---|---|---|
| 31.12.2018 | 43 | 44 | 41 |
| 30.12.2018 | 39 | 41 | 37 |
| 29.12.2018 | 38 | 41 | 35 |
| 28.12.2018 | 42 | 44 | 40 |
| 27.12.2018 | 46 | 48 | 44 |
| 26.12.2018 | 51 | 55 | 48 |
| 25.12.2018 | 63 | 75 | 55 |
© Bayerisches Landesamt für Umwelt 2025