
- Startseite >
- Flüsse >
- Wasserstand >
- Untere Donau >
- Untergoßzell >
- Jahresgrafik

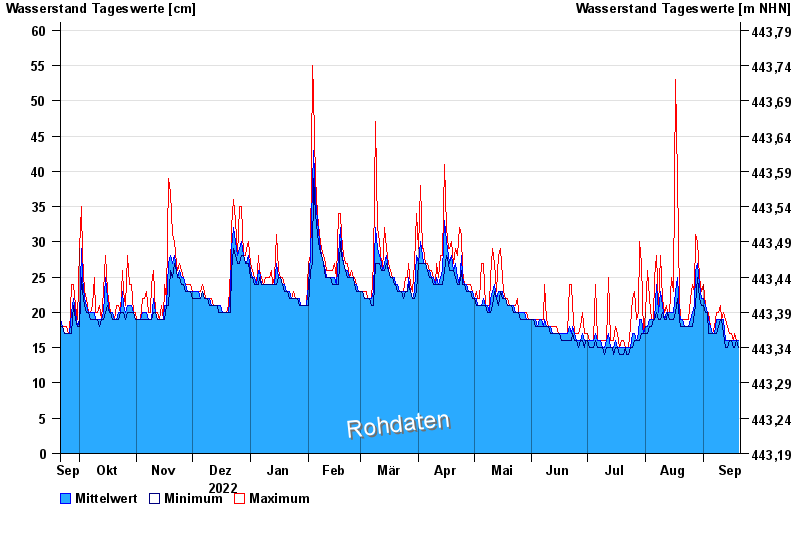
Jahresgrafik Untergoßzell / Trailbach
Wasserstand vom 21.09.2022 bis zum 20.09.2023
| Datum | Mittelwert [cm] | Maximum [cm] | Minimum [cm] |
|---|---|---|---|
| 20.09.2023 | 16 | 16 | 15 |
| 19.09.2023 | 16 | 16 | 16 |
| 18.09.2023 | 16 | 17 | 15 |
| 17.09.2023 | 16 | 16 | 15 |
| 16.09.2023 | 16 | 17 | 16 |
| 15.09.2023 | 16 | 17 | 16 |
| 14.09.2023 | 16 | 18 | 15 |
© Bayerisches Landesamt für Umwelt 2024