
- Startseite >
- Flüsse >
- Wasserstand >
- Regnitz >
- Büg >
- Jahresgrafik

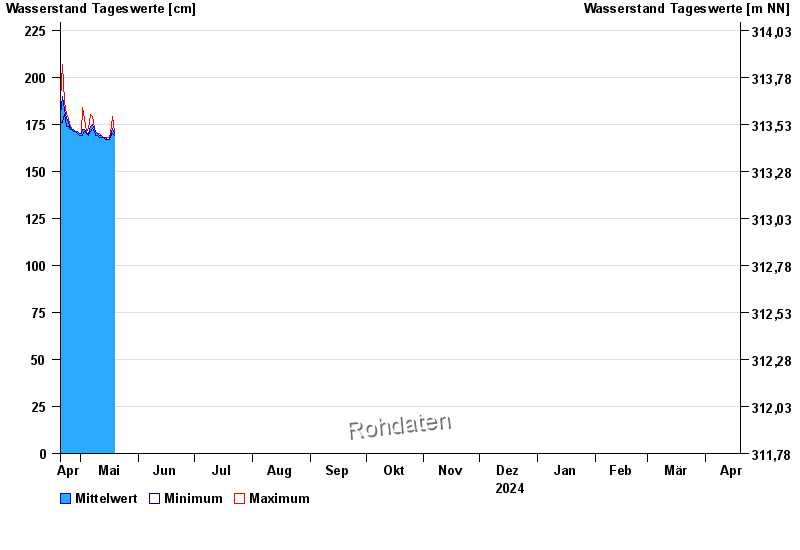
Jahresgrafik Büg / Schwabach
Wasserstand vom 20.04.2024 bis zum 19.04.2025
- 20.07.2011 Wasserstand: 409 cm
- 28.10.1998 Wasserstand: 404 cm
- 26.01.1995 Wasserstand: 401 cm
- 29.01.2021 Wasserstand: 390 cm
- 19.07.1966 Wasserstand: 390 cm
| Datum | Mittelwert [cm] | Maximum [cm] | Minimum [cm] |
|---|---|---|---|
| 13.09.2024 | 162 | 163 | 161 |
| 12.09.2024 | 164 | 167 | 162 |
| 11.09.2024 | 162 | 167 | 161 |
| 10.09.2024 | 161 | 162 | 161 |
| 09.09.2024 | 164 | 169 | 161 |
| 08.09.2024 | 159 | 164 | 159 |
| 07.09.2024 | 160 | 160 | 159 |
© Bayerisches Landesamt für Umwelt 2024