
- Startseite >
- Flüsse >
- Wassertemperatur >
- Bayern >
- Mittenwald >
- Jahresgrafik

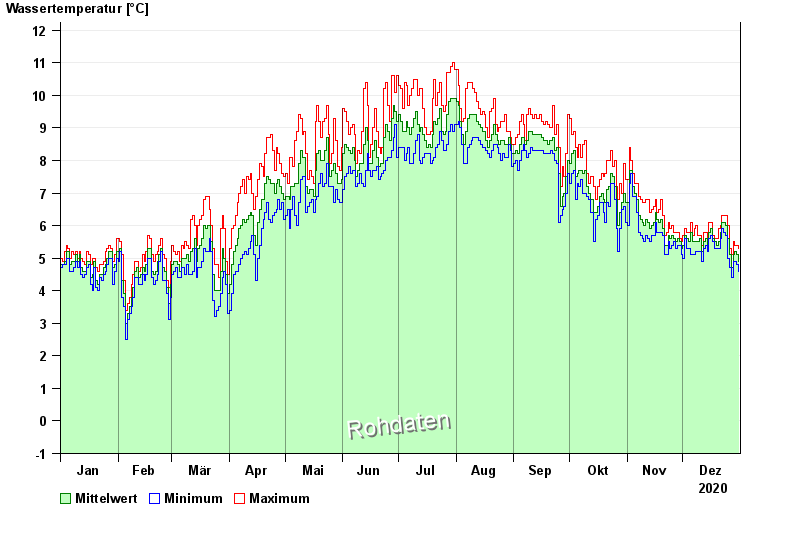
Jahresgrafik Mittenwald / Isar
Wassertemperatur vom 01.01.2020 bis zum 31.12.2020
| Datum | Wassertemperatur [°C] | Maximum [°C] | Minimum [°C] |
|---|---|---|---|
| 31.12.2020 | 4,9 | 5,3 | 4,6 |
| 30.12.2020 | 5,1 | 5,4 | 4,8 |
| 29.12.2020 | 5,2 | 5,4 | 4,9 |
| 28.12.2020 | 5,1 | 5,5 | 4,9 |
| 27.12.2020 | 4,7 | 5,1 | 4,4 |
| 26.12.2020 | 5,1 | 5,3 | 4,7 |
| 25.12.2020 | 5,6 | 6,0 | 5,0 |
© Bayerisches Landesamt für Umwelt 2025