
- Startseite >
- Meteorologie >
- Globalstrahlung >
- Bayern >
- Baumannshof >
- Jahresgrafik

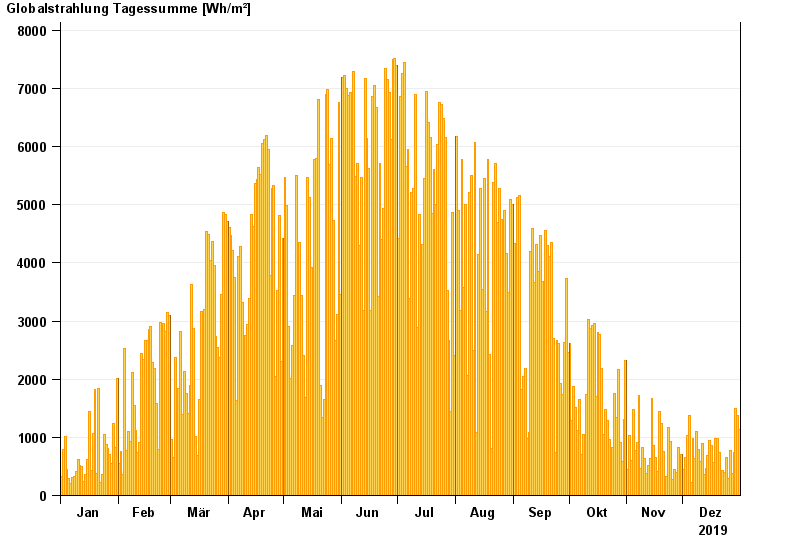
Jahresgrafik Baumannshof
Globalstrahlung vom 01.01.2019 bis zum 31.12.2019
| Datum | Globalstrahlung [Wh/m²] |
|---|---|
| 31.12.2019 | 1129,7 |
| 30.12.2019 | 1373,5 |
| 29.12.2019 | 1489,0 |
| 28.12.2019 | 742,2 |
| 27.12.2019 | 373,8 |
| 26.12.2019 | 781,7 |
| 25.12.2019 | 293,2 |
© Bayerisches Landesamt für Umwelt 2025