
- Startseite >
- Meteorologie >
- Globalstrahlung >
- Isar >
- Rothenfeld >
- Jahresgrafik

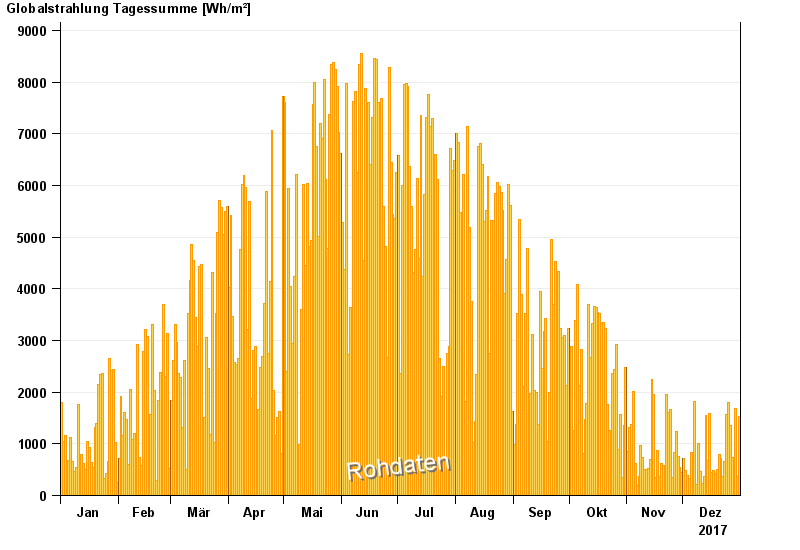
Jahresgrafik Rothenfeld
Globalstrahlung vom 01.01.2017 bis zum 31.12.2017
| Datum | Globalstrahlung [Wh/m²] |
|---|---|
| 31.12.2017 | 1535,3 |
| 30.12.2017 | 358,4 |
| 29.12.2017 | 1676,3 |
| 28.12.2017 | 361,1 |
| 27.12.2017 | 743,8 |
| 26.12.2017 | 1360,9 |
| 25.12.2017 | 1791,6 |
© Bayerisches Landesamt für Umwelt 2025