
- Startseite >
- Meteorologie >
- Globalstrahlung >
- Obere Donau >
- Wadenbrunn >
- Jahresgrafik

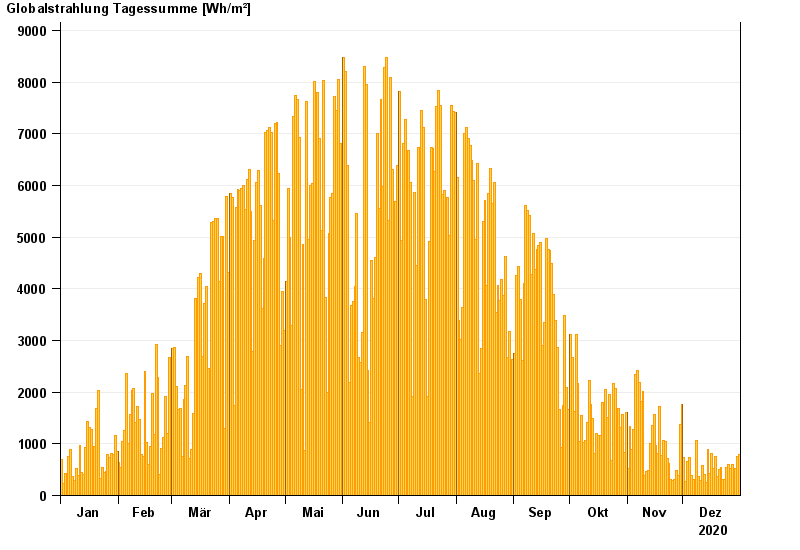
Jahresgrafik Wadenbrunn
Globalstrahlung vom 01.01.2020 bis zum 31.12.2020
| Datum | Globalstrahlung [Wh/m²] |
|---|---|
| 31.12.2020 | 796,7 |
| 30.12.2020 | 760,7 |
| 29.12.2020 | 523,7 |
| 28.12.2020 | 413,5 |
| 27.12.2020 | 602,0 |
| 26.12.2020 | 530,0 |
| 25.12.2020 | 604,5 |
© Bayerisches Landesamt für Umwelt 2025