
- Startseite >
- Meteorologie >
- Relative Luftfeuchte >
- Bayern >
- Karwendel Markklamm 900m >
- Jahresgrafik

Jahresgrafik Karwendel Markklamm 900m
Relative Luftfeuchte vom 01.01.2021 bis zum 31.12.2021
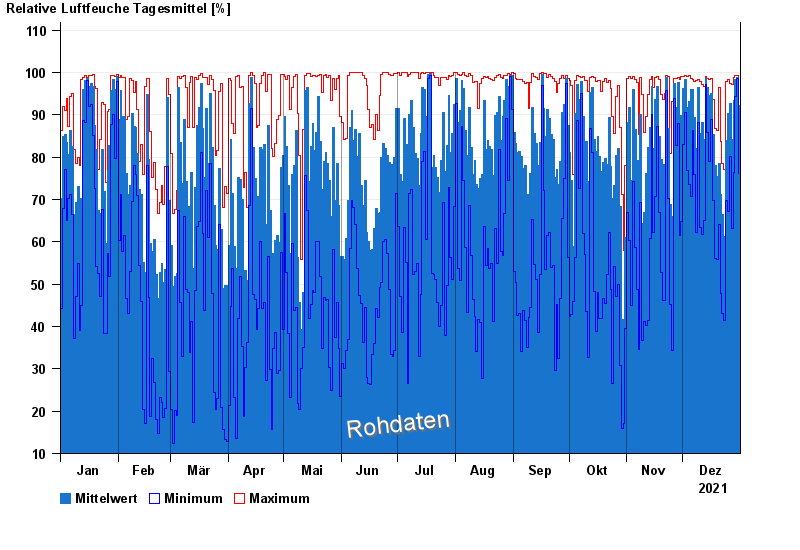
| Datum | Mittelwert [%] | Maximum [%] | Minimum [%] |
|---|---|---|---|
| 31.12.2021 | 92,3 | 98,9 | 76,1 |
| 30.12.2021 | 98,9 | 99,2 | 98,5 |
| 29.12.2021 | 98,4 | 99,2 | 94,4 |
| 28.12.2021 | 93,4 | 98,9 | 76,5 |
| 27.12.2021 | 84,2 | 97,1 | 63,1 |
| 26.12.2021 | 92,7 | 97,4 | 80,1 |
| 25.12.2021 | 90,4 | 98,3 | 67,2 |
© Bayerisches Landesamt für Umwelt 2025