
- Startseite >
- Meteorologie >
- Relative Luftfeuchte >
- Bayern >
- Seligenstadt >
- Jahresgrafik

Jahresgrafik Seligenstadt
Relative Luftfeuchte vom 01.01.2018 bis zum 31.12.2018
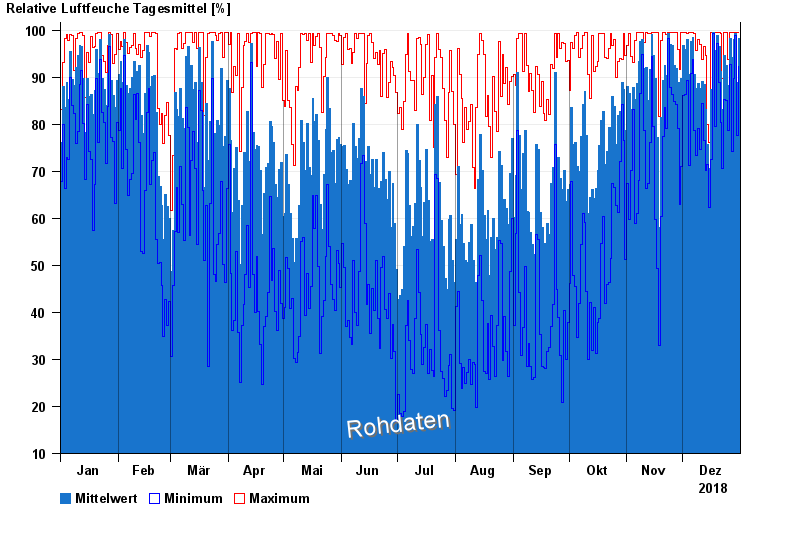
| Datum | Mittelwert [%] | Maximum [%] | Minimum [%] |
|---|---|---|---|
| 31.12.2018 | 98,2 | 99,5 | 92,2 |
| 30.12.2018 | 88,8 | 99,5 | 77,6 |
| 29.12.2018 | 99,4 | 99,5 | 98,9 |
| 28.12.2018 | 98,1 | 99,6 | 89,8 |
| 27.12.2018 | 94,3 | 99,5 | 74,3 |
| 26.12.2018 | 98,3 | 99,6 | 92,7 |
| 25.12.2018 | 88,3 | 93,7 | 78,6 |
© Bayerisches Landesamt für Umwelt 2025