
- Startseite >
- Meteorologie >
- Relative Luftfeuchte >
- Isar >
- Traunreut-Stein >
- Jahresgrafik

Jahresgrafik Traunreut-Stein
Relative Luftfeuchte vom 01.01.2023 bis zum 31.12.2023
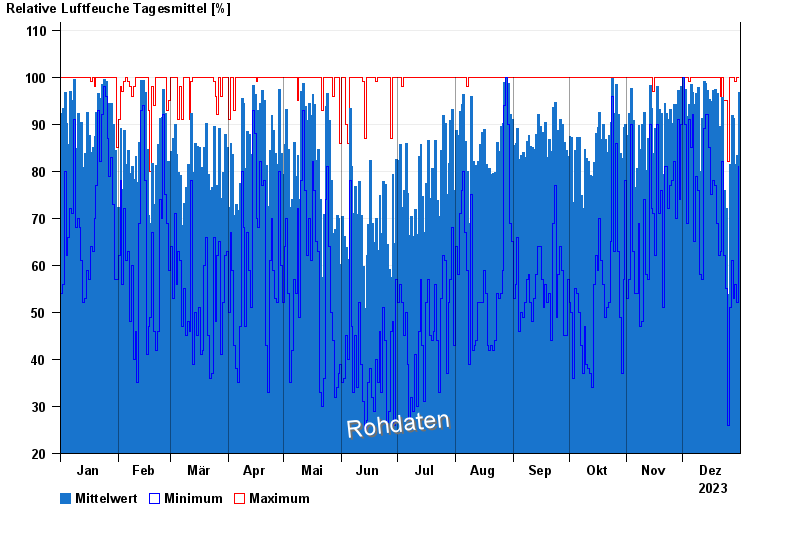
| Datum | Mittelwert [%] | Maximum [%] | Minimum [%] |
|---|---|---|---|
| 31.12.2023 | 96,7 | 100,0 | 81,0 |
| 30.12.2023 | 83,4 | 100,0 | 52,0 |
| 29.12.2023 | 81,5 | 99,0 | 56,0 |
| 28.12.2023 | 91,2 | 100,0 | 53,0 |
| 27.12.2023 | 91,9 | 100,0 | 61,0 |
| 26.12.2023 | 81,5 | 100,0 | 51,0 |
| 25.12.2023 | 53,8 | 82,0 | 26,0 |
© Bayerisches Landesamt für Umwelt 2025