
- Startseite >
- Meteorologie >
- Relative Luftfeuchte >
- Obere Donau >
- Hepberg >
- Jahresgrafik

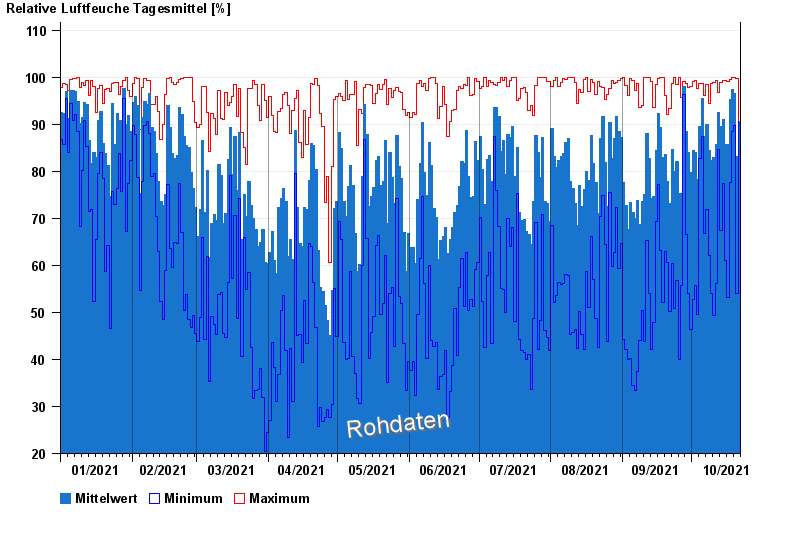
Jahresgrafik Hepberg
Relative Luftfeuchte vom 01.01.2021 bis zum 21.10.2021
| Datum | Mittelwert [%] | Maximum [%] | Minimum [%] |
|---|---|---|---|
| 21.10.2021 | 90,5 | 90,5 | 90,5 |
| 20.10.2021 | 83,1 | 99,8 | 54,1 |
| 19.10.2021 | 96,6 | 100,0 | 89,8 |
| 18.10.2021 | 97,3 | 100,0 | 88,5 |
| 17.10.2021 | 95,2 | 99,6 | 77,7 |
| 16.10.2021 | 85,6 | 99,0 | 53,1 |
| 15.10.2021 | 85,8 | 99,3 | 61,0 |
© Bayerisches Landesamt für Umwelt 2026