
- Startseite >
- Meteorologie >
- Relative Luftfeuchte >
- Unterer Main >
- Albertshofen >
- Jahresgrafik

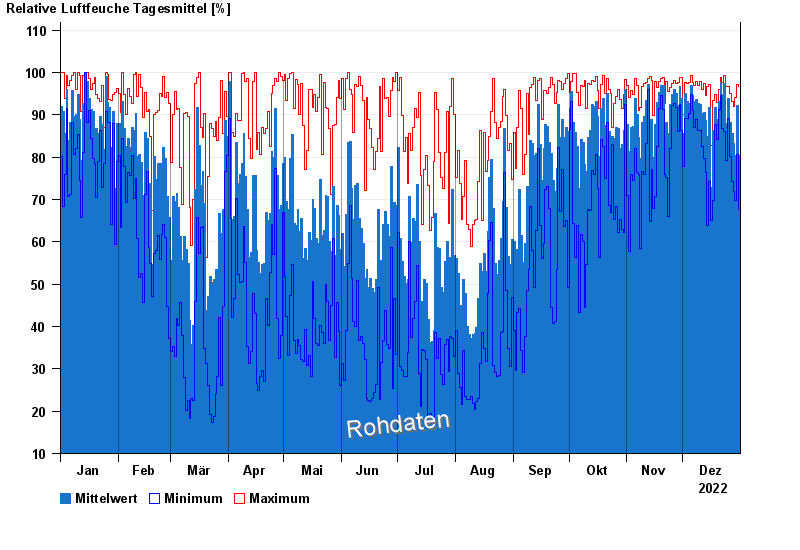
Jahresgrafik Albertshofen
Relative Luftfeuchte vom 01.01.2022 bis zum 31.12.2022
| Datum | Mittelwert [%] | Maximum [%] | Minimum [%] |
|---|---|---|---|
| 31.12.2022 | 80,5 | 96,6 | 67,7 |
| 30.12.2022 | 92,1 | 97,2 | 80,6 |
| 29.12.2022 | 80,3 | 94,1 | 69,8 |
| 28.12.2022 | 83,3 | 92,0 | 72,0 |
| 27.12.2022 | 85,7 | 93,2 | 74,3 |
| 26.12.2022 | 88,1 | 95,0 | 80,1 |
| 25.12.2022 | 93,9 | 96,8 | 89,1 |
© Bayerisches Landesamt für Umwelt 2025