
- Startseite >
- Meteorologie >
- Relative Luftfeuchte >
- Unterer Main >
- Heilsbronn_Aich >
- Jahresgrafik

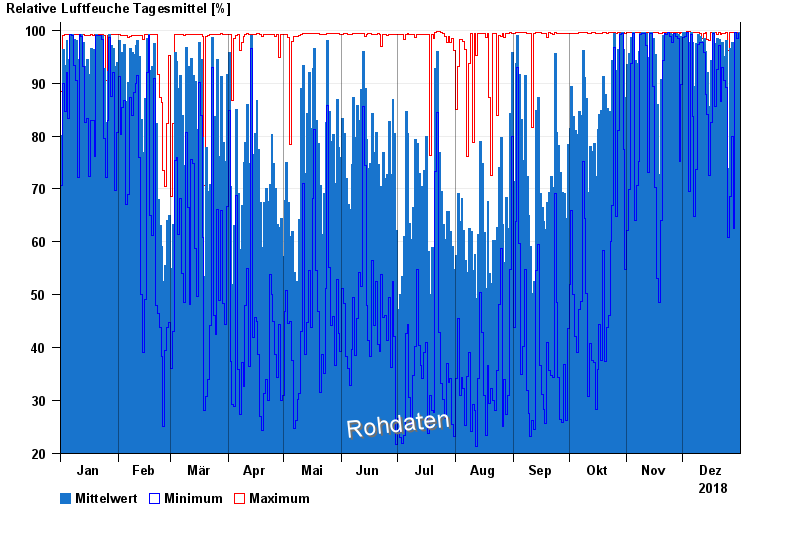
Jahresgrafik Heilsbronn_Aich
Relative Luftfeuchte vom 01.01.2018 bis zum 31.12.2018
| Datum | Mittelwert [%] | Maximum [%] | Minimum [%] |
|---|---|---|---|
| 31.12.2018 | 99,5 | 99,6 | 99,3 |
| 30.12.2018 | 99,3 | 99,6 | 98,5 |
| 29.12.2018 | 99,5 | 99,6 | 99,5 |
| 28.12.2018 | 92,6 | 99,5 | 62,5 |
| 27.12.2018 | 97,7 | 99,5 | 80,0 |
| 26.12.2018 | 96,5 | 99,5 | 68,5 |
| 25.12.2018 | 73,9 | 96,2 | 60,8 |
© Bayerisches Landesamt für Umwelt 2024