
- Startseite >
- Meteorologie >
- Relative Luftfeuchte >
- Unterer Main >
- Veitshöchheim >
- Jahresgrafik

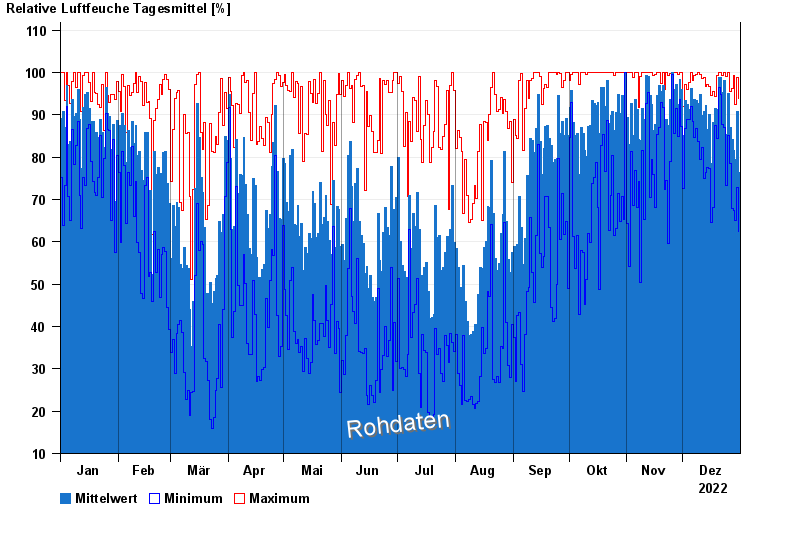
Jahresgrafik Veitshöchheim
Relative Luftfeuchte vom 01.01.2022 bis zum 31.12.2022
| Datum | Mittelwert [%] | Maximum [%] | Minimum [%] |
|---|---|---|---|
| 31.12.2022 | 76,4 | 93,8 | 62,4 |
| 30.12.2022 | 90,9 | 98,9 | 72,9 |
| 29.12.2022 | 79,4 | 92,5 | 65,1 |
| 28.12.2022 | 81,6 | 99,3 | 67,3 |
| 27.12.2022 | 84,2 | 96,2 | 67,8 |
| 26.12.2022 | 87,1 | 95,5 | 78,6 |
| 25.12.2022 | 95,1 | 100,0 | 85,1 |
© Bayerisches Landesamt für Umwelt 2025