
- Startseite >
- Meteorologie >
- Lufttemperatur >
- Unterer Main >
- Fladungen-Leubach >
- Jahresgrafik

Jahresgrafik Fladungen-Leubach
Lufttemperatur vom 01.01.2023 bis zum 31.12.2023
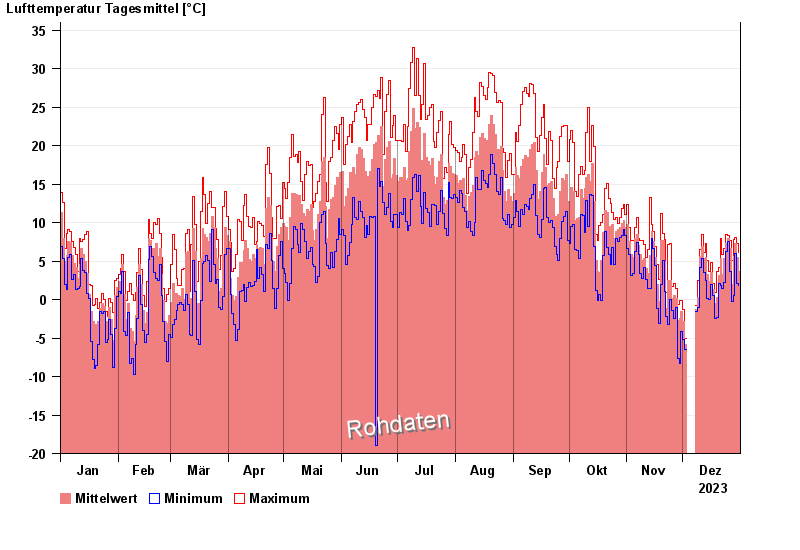
Hinweis: Die Zeitreihe im gewählten Zeitraum weist Lücken auf.
| Datum | Mittelwert [°C] | Maximum [°C] | Minimum [°C] |
|---|---|---|---|
| 31.12.2023 | 3,7 | 6,1 | 1,8 |
| 30.12.2023 | 5,5 | 7,3 | 2,1 |
| 29.12.2023 | 7,3 | 8,1 | 6,0 |
| 28.12.2023 | 5,6 | 7,8 | 0,5 |
| 27.12.2023 | 1,9 | 5,1 | -0,3 |
| 26.12.2023 | 6,6 | 7,7 | 3,6 |
| 25.12.2023 | 7,9 | 8,3 | 7,5 |
© Bayerisches Landesamt für Umwelt 2025