
- Startseite >
- Meteorologie >
- Wind >
- Untere Donau >
- Vilstalsee Auslaufbauwerk >
- Jahresgrafik

Jahresgrafik Vilstalsee Auslaufbauwerk
Wind vom 01.01.2022 bis zum 31.12.2022
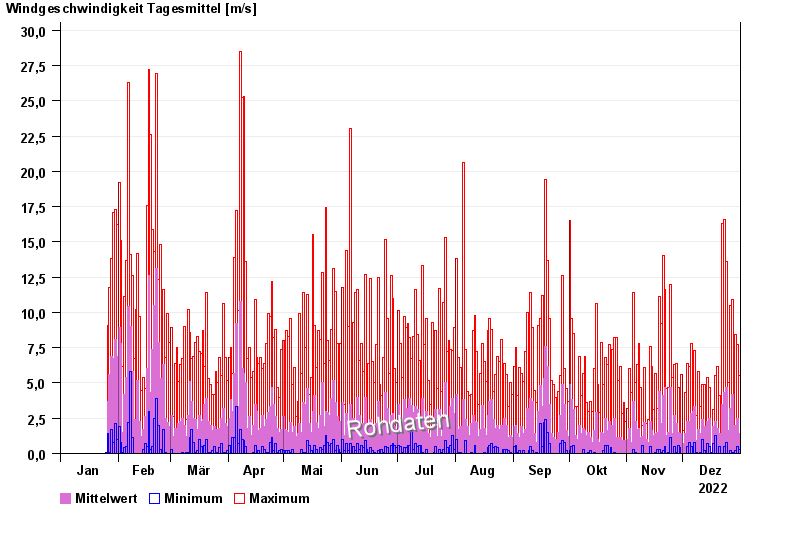
| Datum | Mittelwert [m/s] | Maximum [m/s] | Minimum [m/s] |
|---|---|---|---|
| 31.12.2022 | 1,4 | 5,5 | 0,3 |
| 30.12.2022 | 2,5 | 7,7 | 0,5 |
| 29.12.2022 | 2,0 | 8,4 | 0,2 |
| 28.12.2022 | 1,3 | 5,8 | 0,0 |
| 27.12.2022 | 4,2 | 10,9 | 0,1 |
| 26.12.2022 | 3,2 | 10,5 | 0,2 |
| 25.12.2022 | 1,6 | 5,0 | 0,0 |
© Bayerisches Landesamt für Umwelt 2025