
- Startseite >
- Seen >
- Wasserstand >
- Isar >
- Oberfinning Seepegel >
- Jahresgrafik

Jahresgrafik Oberfinning Seepegel / Windachspeicher
Wasserstand vom 30.03.2024 bis zum 29.03.2025
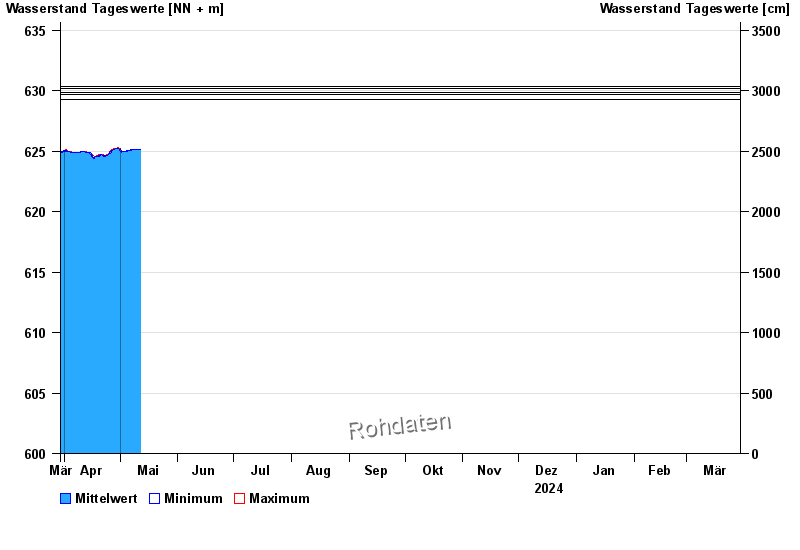
- 07.08.2000 Wasserstand: 630,33 m ü. NN
- 22.05.1999 Wasserstand: 630,17 m ü. NN
- 11.06.1965 Wasserstand: 629,83 m ü. NN
- 18.06.1979 Wasserstand: 629,69 m ü. NN
- 14.04.1994 Wasserstand: 629,29 m ü. NN
Linien: keine | Hauptwerte | Meldestufen | mittlerer Seespiegel | Hochwassermarken | historische Ereignisse
| Datum | Mittelwert [m ü. NN] | Maximum [m ü. NN] | Minimum [m ü. NN] |
|---|---|---|---|
| 13.07.2024 | 625,58 | 625,84 | 625,33 |
| 12.07.2024 | 625,16 | 625,31 | 625,11 |
| 11.07.2024 | 625,30 | 625,36 | 625,12 |
| 10.07.2024 | 625,19 | 625,32 | 625,17 |
| 09.07.2024 | 625,16 | 625,17 | 625,15 |
| 08.07.2024 | 625,14 | 625,15 | 625,11 |
| 07.07.2024 | 625,07 | 625,11 | 625,03 |
© Bayerisches Landesamt für Umwelt 2024