
- Startseite >
- Seen >
- Wasserstand >
- Isar >
- Riegsee >
- Jahresgrafik

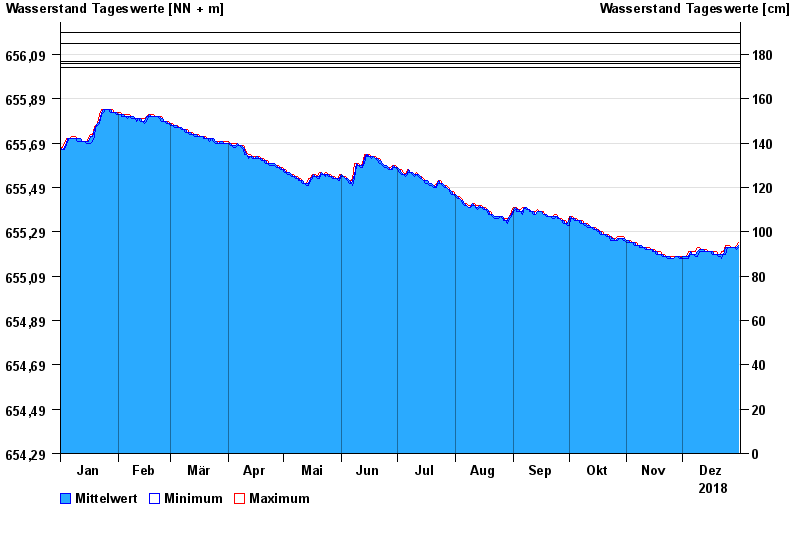
Jahresgrafik Riegsee / Riegsee
Wasserstand vom 01.01.2018 bis zum 31.12.2018
- 29.06.1979 Wasserstand: 656,19 m ü. NN
- 10.07.1990 Wasserstand: 656,14 m ü. NN
- 12.01.1982 Wasserstand: 656,06 m ü. NN
- 29.09.1989 Wasserstand: 656,05 m ü. NN
- 23.05.1999 Wasserstand: 656,03 m ü. NN
Linien: keine | Hauptwerte | Meldestufen | mittlerer Seespiegel | Hochwassermarken | historische Ereignisse
| Datum | Mittelwert [m ü. NN] | Maximum [m ü. NN] | Minimum [m ü. NN] |
|---|---|---|---|
| 31.12.2018 | 655,21 | 655,22 | 655,20 |
| 30.12.2018 | 655,20 | 655,21 | 655,19 |
| 29.12.2018 | 655,20 | 655,20 | 655,20 |
| 28.12.2018 | 655,20 | 655,20 | 655,20 |
| 27.12.2018 | 655,20 | 655,20 | 655,20 |
| 26.12.2018 | 655,20 | 655,21 | 655,20 |
| 25.12.2018 | 655,20 | 655,21 | 655,20 |
© Bayerisches Landesamt für Umwelt 2025