
- Start >
- Groundwater >
- Chemistry >
- Untere Donau >
- 1131713800015 >
- Chart of total period

Chart of total period 1131713800015
Data from 30.05.2007 to 14.04.2021
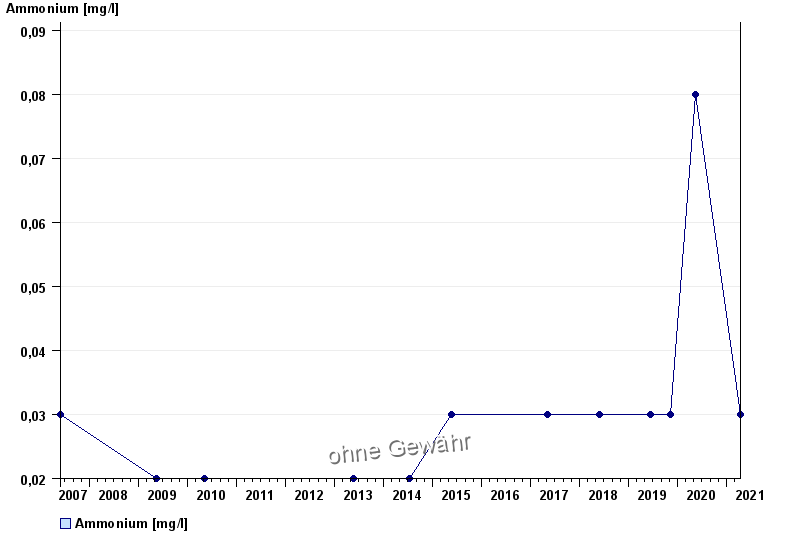
| Date | Ammonium [mg/l] |
|---|---|
| 14.04.2021 | < 0.03 |
| 14.05.2020 | 0.08 |
| 06.11.2019 | < 0.03 |
| 12.06.2019 | < 0.03 |
| 29.05.2018 | < 0.03 |
| 03.05.2017 | < 0.03 |
| 16.06.2016 | |
© Bayerisches Landesamt für Umwelt 2025