
- Start >
- Groundwater >
- Waterlevel of deep layer >
- Bayern >
- OTTERW./NIEDERRIEDEN >
- Chart of total period

Chart of total period OTTERW./NIEDERRIEDEN
Groundwater levels of the total period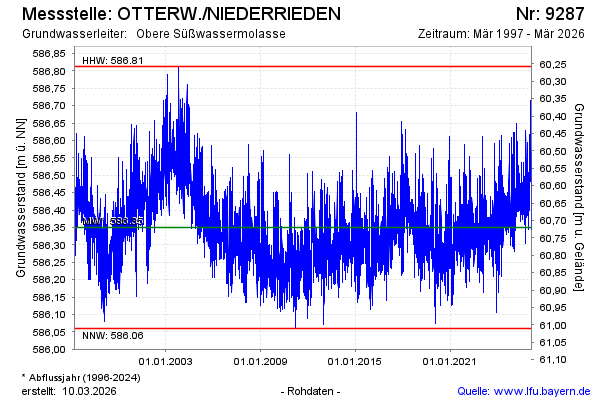
Groundwater level [m above sealevel]: 586.34
Distance to surface [m]: 60.73
Last value from 02.03.2025 04:00
Ground level [m above sealevel]: 647.07
| Date | Groundwater level [m above sealevel] |
|---|---|
| 01.03.2025 | 586.39 |
| 28.02.2025 | 586.41 |
| 27.02.2025 | 586.44 |
| 26.02.2025 | 586.45 |
| 25.02.2025 | 586.46 |
| 24.02.2025 | 586.38 |
| 23.02.2025 | 586.34 |
| 22.02.2025 | 586.41 |
© Bayerisches Landesamt für Umwelt 2025