
- Start >
- Groundwater >
- Waterlevel of deep layer >
- Bayern >
- WACKERSDORF 2KT >
- Chart of total period

Chart of total period WACKERSDORF 2KT
Groundwater levels of the total period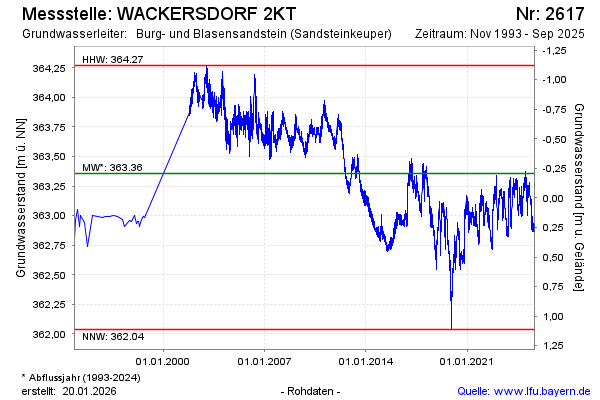
Groundwater level [m above sealevel]: 363.25
Distance to surface [m]: -0.10
Last value from 13.01.2025 08:45
Ground level [m above sealevel]: 363.15
Date | Groundwater level [m above sealevel] |
|---|---|
| 08.01.2025 | 363.29 |
| 07.01.2025 | 363.29 |
| 06.01.2025 | 363.31 |
| 05.01.2025 | 363.28 |
| 04.01.2025 | 363.23 |
| 03.01.2025 | 363.24 |
| 02.01.2025 | 363.25 |
| 01.01.2025 | 363.21 |
© Bayerisches Landesamt für Umwelt 2025